| Statistics Toolbox | |
Defining the Links Between Objects
Once the proximity between objects in the data set has been computed, you can determine which objects in the data set should be grouped together into clusters, using the linkage function. The linkage function takes the distance information generated by pdist and links pairs of objects that are close together into binary clusters (clusters made up of two objects). The linkage function then links these newly formed clusters to other objects to create bigger clusters until all the objects in the original data set are linked together in a hierarchical tree.
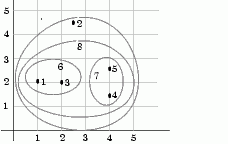
For example, given the distance vector Y generated by pdist from the sample data set of x and y coordinates, the linkage function generates a hierarchical cluster tree, returning the linkage information in a matrix, Z.
Z = linkage(Y)
Z =
    1.0000    3.0000    1.0000
    4.0000    5.0000    1.0000
    6.0000    7.0000    2.0616
    8.0000    2.0000    2.5000
In this output, each row identifies a link. The first two columns identify the objects that have been linked, that is, object 1, object 2, and so on. The third column contains the distance between these objects. For the sample data set of x and y coordinates, the linkage function begins by grouping together objects 1 and 3, which have the closest proximity (distance value = 1.0000). The linkage function continues by grouping objects 4 and 5, which also have a distance value of 1.0000.
The third row indicates that the linkage function grouped together objects 6 and 7. If our original sample data set contained only five objects, what are objects 6 and 7? Object 6 is the newly formed binary cluster created by the grouping of objects 1 and 3. When the linkage function groups two objects together into a new cluster, it must assign the cluster a unique index value, starting with the value m+1, where m is the number of objects in the original data set. (Values 1 through m are already used by the original data set.) Object 7 is the index for the cluster formed by objects 4 and 5.
As the final cluster, the linkage function grouped object 8, the newly formed cluster made up of objects 6 and 7, with object 2 from the original data set. The following figure graphically illustrates the way linkage groups the objects into a hierarchy of clusters.
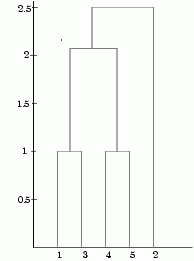
The hierarchical, binary cluster tree created by the linkage function is most easily understood when viewed graphically. The Statistics Toolbox includes the dendrogram function that plots this hierarchical tree information as a graph, as in the following example.
dendrogram(Z)
In the figure, the numbers along the horizontal axis represent the indices of the objects in the original data set. The links between objects are represented as upside down U-shaped lines. The height of the U indicates the distance between the objects. For example, the link representing the cluster containing objects 1 and 3 has a height of 1. For more information about creating a dendrogram diagram, see the dendrogram function reference page.
| | Finding the Similarities Between Objects | Evaluating Cluster Formation | |