
| Wavelet Toolbox |   |
Complex Continuous Analysis Using the Graphical Interface
We now use the Complex Continuous Wavelet 1-D tool to analyze the same cusp signal we examined using the command line interface in the previous section.
Starting the Complex Continuous Wavelet 1-D Tool.
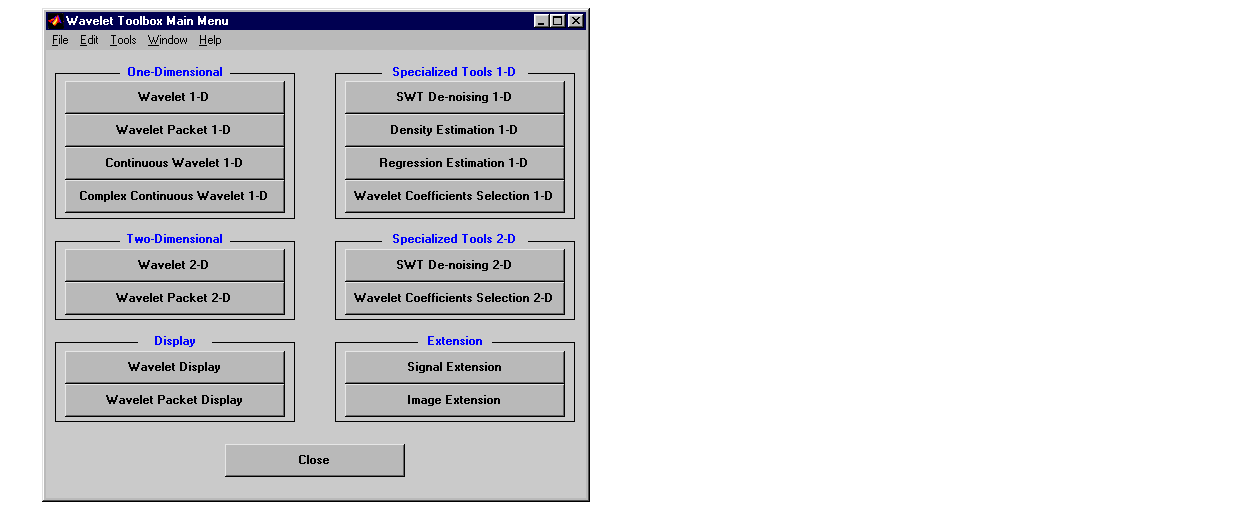
The Wavelet Toolbox Main Menu appears.
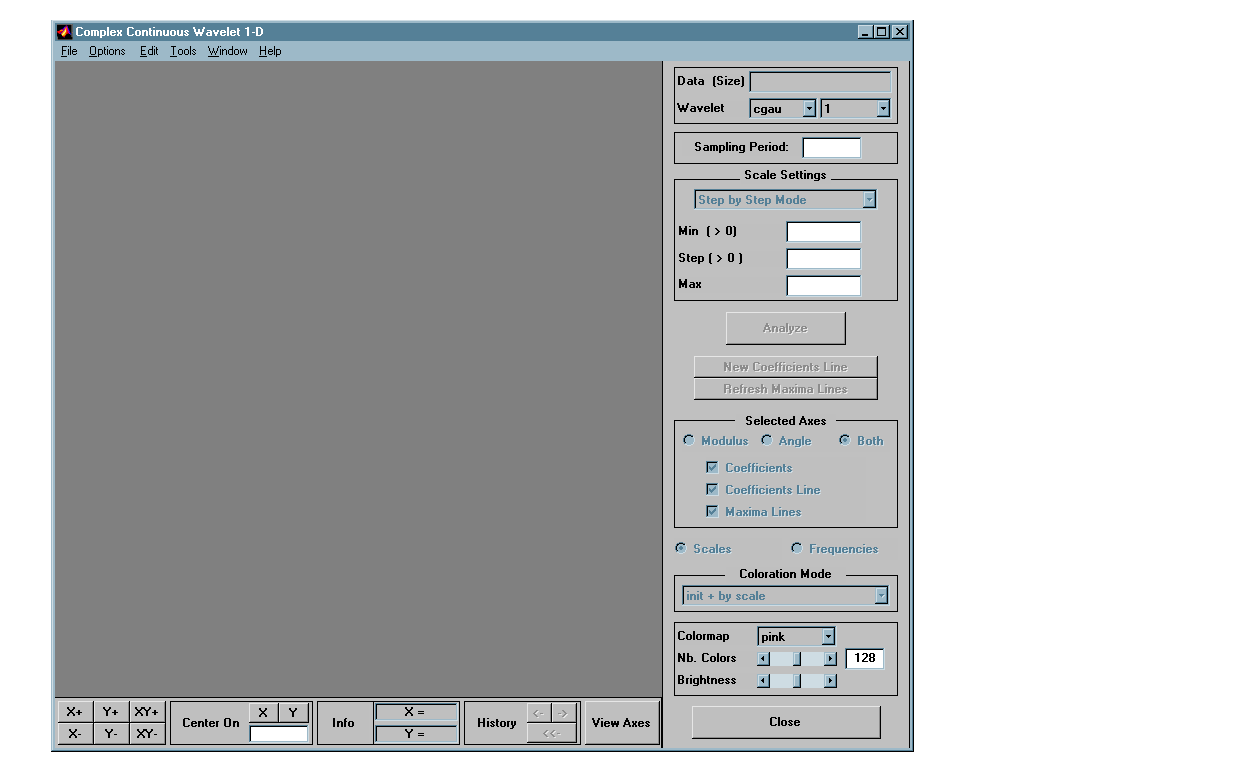
The continuous wavelet analysis tool for one-dimensional signal data
appears.
 Load Signal menu option.
cuspamax.mat, which should reside in the MATLAB directory toolbox/wavelet/wavedemo. Click the OK button.
The cusp signal is loaded into the Complex Continuous Wavelet 1-D tool.
The default value for the sampling period is equal to 1 (second).
Performing a Complex Continuous Wavelet Transform.
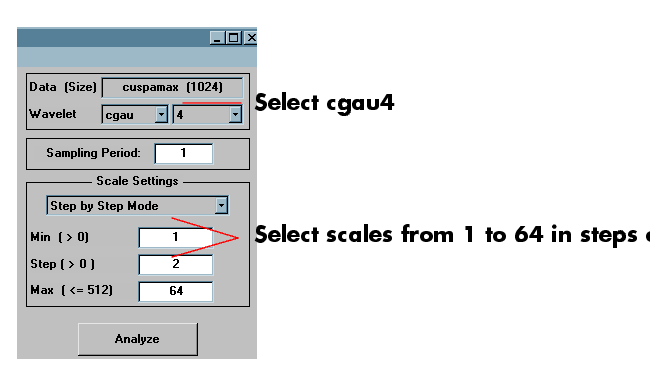
To start our analysis, let's perform an analysis using the cgau4 wavelet at scales 1 through 64 in steps of 2, just as we did using command line functions in Complex Continuous Analysis Using the Command Line.
cgau4 wavelet and scales 1-64 in steps of 2.
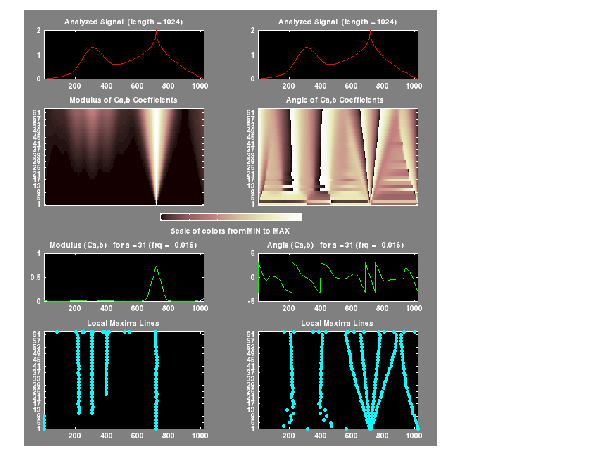
After a pause for computation, the tool displays the usual plots associated to
the modulus of the coefficients on the left side, and the angle of the
coefficients on the right side.
Each side has exactly the same representation that we found in the section Continuous Analysis Using the Graphical Interface on page 2-9.
The figure now looks like the one in the real Continuous Wavelet 1-D tool.
 | Complex Continuous Analysis Using the Command Line | Importing and Exporting Information from the Graphical Interface |  |