
| Wavelet Toolbox |   |
Complex Continuous Analysis Using the Command Line
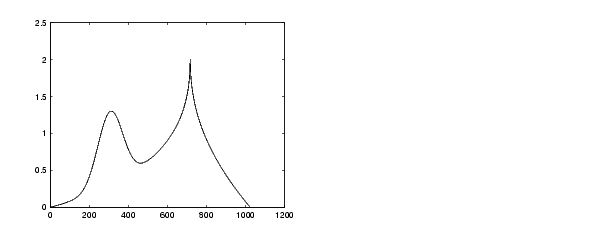
This example involves a cusp signal.
You now have the signal cuspamax in your workspace:
whos
|
|
|
|
|
|
|
|
|
|
|
caption |
1x71 |
142 |
char array |
|
cuspamax |
|
|
|
caption is a string that contains the signal definition.
Performing a Continuous Wavelet Transform.
cwt command. Type:
c = cwt(cuspamax,1:2:64,'cgau4');
The arguments to cwt specify the signal to be analyzed, the scales of the
analysis, and the wavelet to be used. The returned argument c contains the
coefficients at various scales. In this case, c is a complex 32-by-1024 matrix,
each row of which corresponds to a single scale.
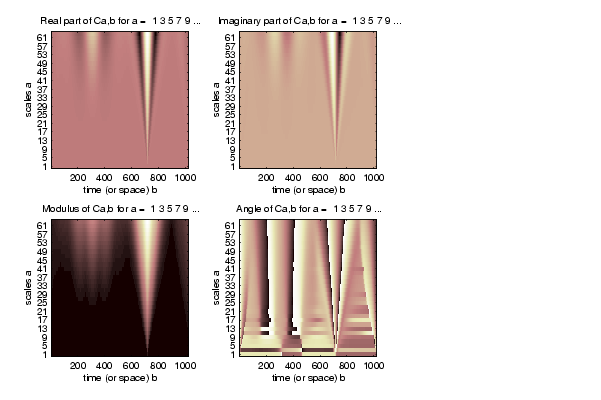
The cwt command accepts a fourth argument. This is a flag that, when present, causes cwt to produce four plots related to the complex continuous wavelet transform coefficients:
The cwt command can accept more arguments to define the different characteristics of the produced plots. For more information, see the cwt reference page.
A plot appears:
Of course, coefficient plots generated from the command line can be manipulated using ordinary MATLAB graphics commands.
 | One-Dimensional Complex Continuous Wavelet Analysis | Complex Continuous Analysis Using the Graphical Interface |  |