
| Stateflow |   |
Stateflow Debugger User Interface
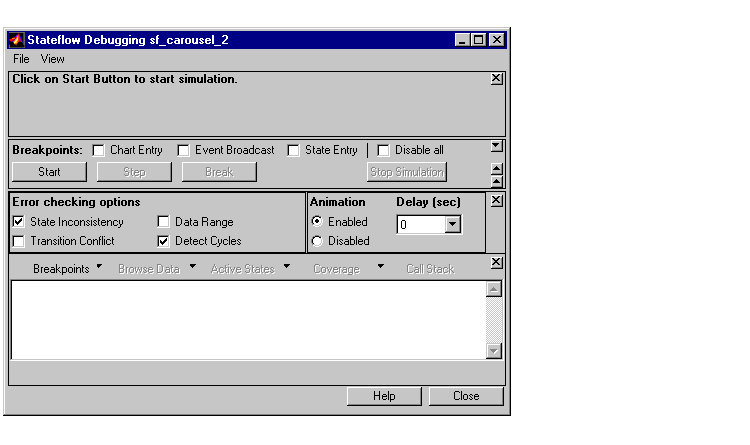
This is the Debugger main window as it appears when first invoked.

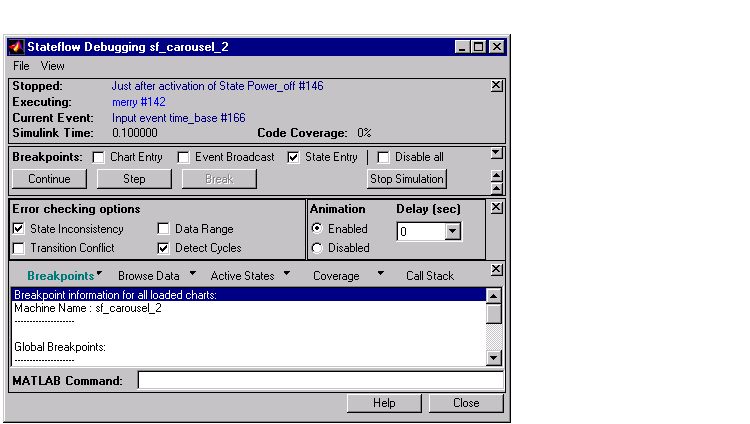
This is the Debugger main window as it appears when a debug session is active.

Status Display Area
Once a debugging session is in progress, these status items are displayed in the upper portion of the Debugger window:
Breakpoint Controls
Use the Breakpoint controls to specify global breakpoints. When a global breakpoint is encountered normal simulation execution stops and the Debugger takes control on any:
Click on the Chart Entry check box (check is displayed when enabled) to enable this type of breakpoint.
Click on the Event Broadcast check box (check is displayed when enabled) to enable this type of breakpoint.
Click on the State Entry check box (check is displayed when enabled) to enable this type of breakpoint.
The breakpoints can be changed during runtime and are immediately enforced. When you save the Stateflow diagram, the breakpoint settings are saved.
Debugger Action Control Buttons
Use these buttons when debugging a Stateflow machine to control the Debugger's actions:
Click on the Go button to have simulation execution proceed until a breakpoint (global or local) is reached. Once the Go button has been clicked, the Stateflow diagram is marked read-only. The appearance of the graphics editor toolbar and menus changes so that object creation is not possible. When the graphics editor is in this read-only mode, it is called "iced."
Click on the Step button to single step through the simulation execution.
Click on the Break button to suspend the simulation and transfer control to the debugger.
Click on the Stop Simulation button to stop the simulation execution and relinquish debugging control. Once the debug session is stopped, the graphics editor toolbar and menus return to their normal appearance and operation so that object creation is again possible.
Animation Controls
Activating animation causes visual color changes (objects are highlighted in the selection color) in the Stateflow diagram based on the simulation execution.
Activate animation by turning on the Enabled check box. Deactivate animation by turning on the Disabled check box. You can specify the animation speed from a range of 0 (fast; the default) to 1 (slow) seconds.
Display Controls
Use these buttons to control the output display:
Click on the Call Stack button to display a sequential list of the Stopped and Current Event status items that occur when single stepping through the simulation.
The Coverage button displays the current percentage of unprocessed transitions, states, etc. at that point in the simulation. Click on the button's drop down list icon to display a list of coverage options: coverage for the current chart only, for all loaded charts, or for all charts in the model.
Click on the Browse Data button to display the current value of any defined data objects.
The Active States button displays a list of active states in the display area. Double-clicking on any state causes the graphics editor to display that state. The drop-down list button on the Active States button lets you specify the extent of the display: active states in the current chart only, in all loaded charts, or for all charts in the model.
Click on the Breakpoints button to display a list of the set breakpoints. The drop-down list button on the Breakpoints button lets you specify the extent of the display: breakpoints in the current chart only or in all loaded charts.
Once you have selected an output display button, that type of output is displayed until you choose a different display type. You can clear the display by selecting Clear Display from the Debugger's File menu.
MATLAB Command Field
Direct access to the MATLAB command window is not possible while the Debugger is stopped at a breakpoint. If you need to enter any MATLAB commands during a debugging session, enter them into the MATLAB Command field and press the Return key.
 | Runtime Debugging | Debugging Runtime Errors |  |