Stateflow    

Chapter 3
Creating Charts


Creating a Chart

To create a Stateflow chart:

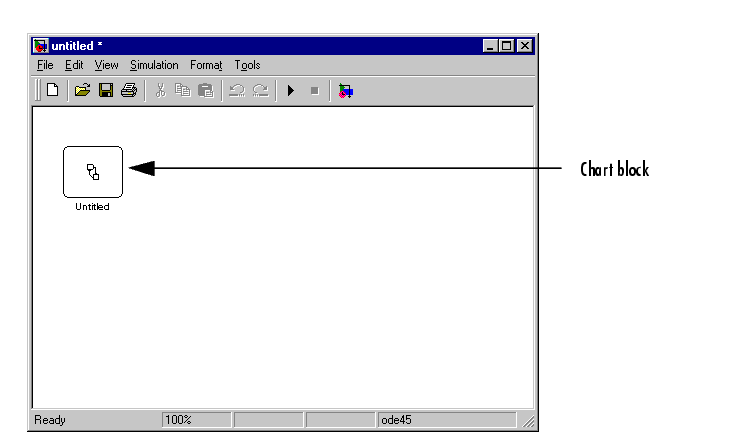
  1. Create a new model with an empty chart block or copy an empty chart from the Stateflow block library into your model.

    To create a new model with an empty chart, enter sfnew or stateflow at the MATLAB command prompt. The first command creates a new model.
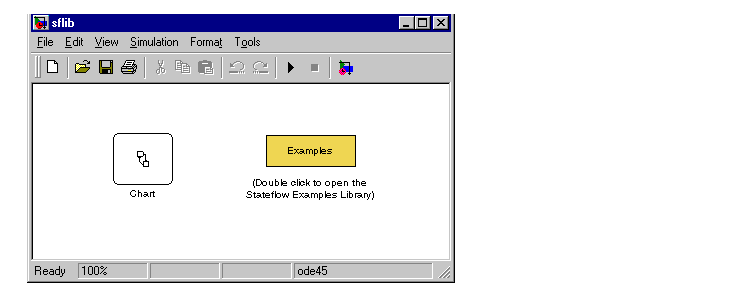
    The second command also displays the Stateflow block library in case you want to create multiple charts in your model.
    For information on creating your own chart libraries, see "Creating Chart Libraries" on page 3-54.

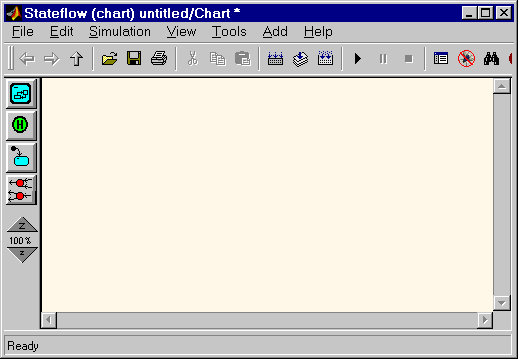
  1. Open the chart by double-clicking on the chart block.

    Stateflow opens the empty chart in a Stateflow editor window.
  1. Use the Stateflow editor to draw and connect states representing the desired state machine or a component of the desired state machine.

    See Using the Stateflow Editor for more information.

  1. Specify a wake up method for the chart.

    See Specifying Chart Properties.

  1. Interface the chart to other charts and blocks in your Stateflow model, using events and data.

    See Chapter 4, Defining Events and Data and Chapter 5, "Defining Stateflow Interfaces for more information.

  1. Rename and save the model chart by selecting Save Model As from the Stateflow editor menu or Save As from the Simulink menu.

 Running the Model Using the Stateflow Editor