| Stateflow | |
Running the Model
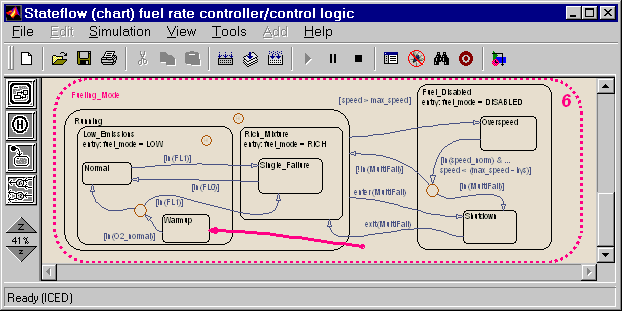
On starting the simulation, and assuming no sensors have failed, the Stateflow diagram initializes in the Warmup mode in which the oxygen sensor is deemed to be in a warmup phase. If Stateflow is placed into animation mode, the current state of the system can clearly be seen highlighted in red on the Stateflow diagram, shown below.
After a given time period, defined by o2_t_thresh, the sensor is deemed to have reached operating temperature and the system settles into the normal mode of operation, shown above, in which the fueling mode is set to NORMAL.
As the simulation progresses, the chart is woken synchronously every 0.01 second. The events and conditions that guard the transitions are evaluated and if a transition is valid, it is taken. The transition itself can be seen animated on the Stateflow diagram.
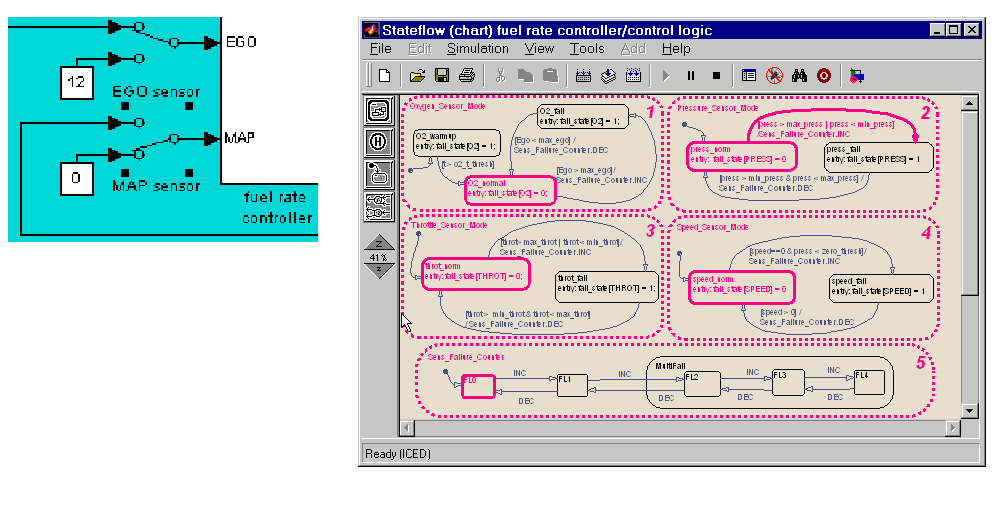
To illustrate this, we can provoke a transition by switching one of the sensors to a failure value on the top level Simulink model. The system detects throttle and pressure sensor failures when their measured values fall outside their nominal ranges. A manifold vacuum in the absence of a speed signal is deemed to indicate a speed sensor failure. The oxygen sensor also has a nominal range for failure conditions but, because zero is both the minimum signal level and the bottom of the range, failure can be detected only when it exceeds the upper limit.
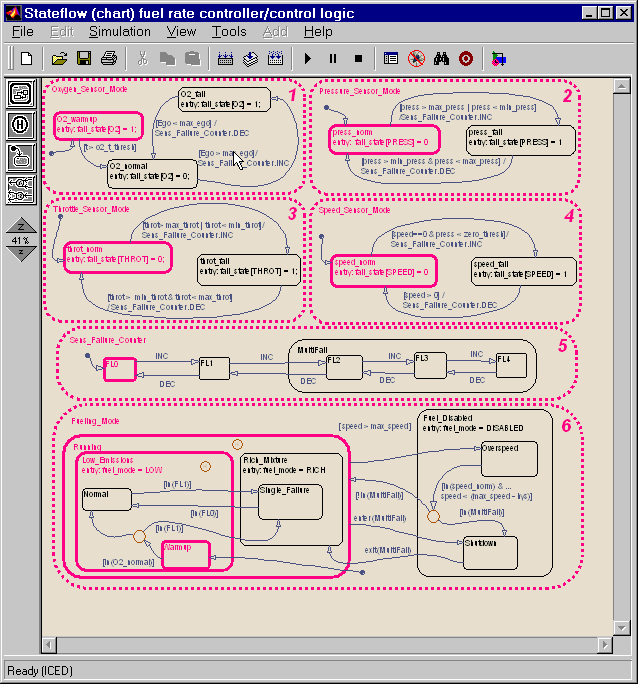
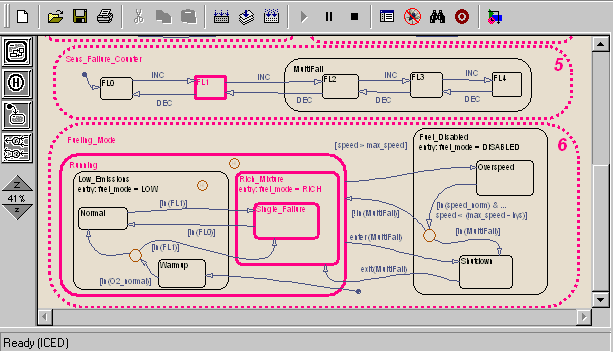
Switching the Simulink switch for the manifold air pressure (MAP) sensor causes a value of zero to be read by the fuel rate controller. When the chart is next woken up, the transition from the press_norm state becomes valid as the reading is now out of bounds and the transition is taken to the press_fail state. Regardless of which sensor fails, the model always generates the directed event broadcast Sens_Failure_Counter.INC. (thus making the triggering of the universal sensor failure logic independent of the sensor). This event causes a second transition from FL0 to FL1 to be taken in the Sens_Failure_Counter superstate. Note that both transitions can be seen animated on the Stateflow diagram below.
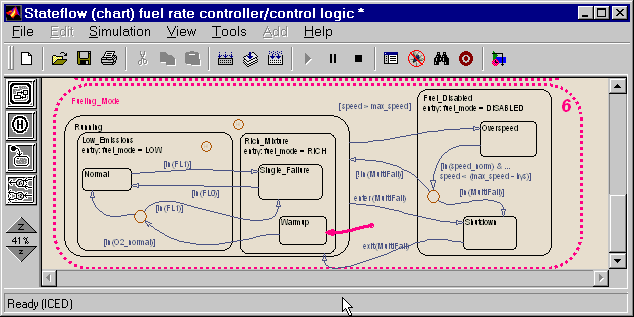
With the Sens_Failure_Counter state showing one failure, the condition that guards the transition from the Low_Emissions.Normal state to the Rich_Mixture.Single_Failure state is now valid and is therefore taken. As the Fuel_Disabled state is entered, the, output fuel_mode is set to RICH, as shown below.
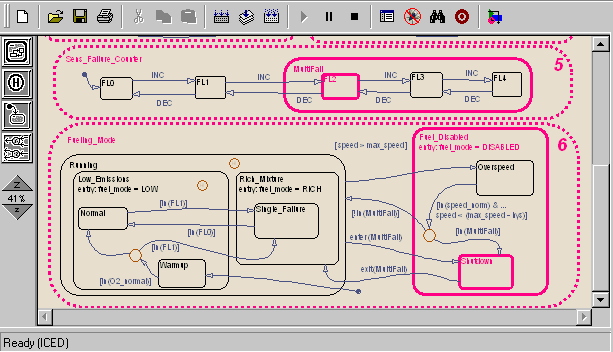
A second sensor failure causes the Sens_Failure_Counter to enter the Multifail state, broadcasting an implicit event which immediately triggers the transition from the Running state to the Shutdown state. On entering the Fuel_Disabled superstate the fueling_mode is DISABLED.
Implicit Event Broadcasts
The fueling example above shows how the control logic can be represented in a clear and intuitive manner. The Stateflow diagram (or chart) has been developed in a way that allows the user, or a reviewer, to easily understand how the logic is structured. Implicit event broadcasts (such as enter(multifail)) and implicit conditions (in(FL0)) make the diagram easy to read and the generated code more efficient.
Modifying the Code
To illustrate how easy it is to modify the algorithm, consider the Warmup fueling state in the fuel control logic. At the moment the fueling is set to the low emissions mode.
It may be decided that when the oxygen sensor is warming up, changing the warmup fueling mode to a rich mixture would be beneficial. In the Stateflow chart this can easily be achieved by changing the parent of the Warmup state to the Rich_Mixture state.
Once made, the alteration is obvious to all who need to inspect or maintain the code.
The results of changing the algorithm can be seen in the graphs of air/fuel mixture ratio for the first few seconds of engine operation after startup.
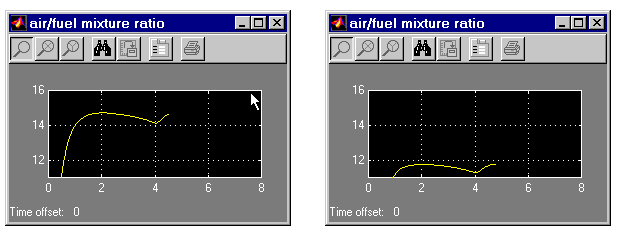
The left graph shows the air fuel ratio for the unaltered system whereas the right graph for the altered system shows how the air/fuel ratio stays low in the warming up phase indicating a rich mixture.
| | Control Logic | Creating Charts | |