| Power System Blockset |
  |
Powergui
Graphical user interface for the analysis of circuits and systems.
Library
powerlib
Description
The Powergui block opens a graphical user interface (GUI) that displays steady-state values of measured current and voltages as well as all state variables (inductor currents and capacitor voltages).
The Powergui block allows you to modify the initial states in order to start the simulation from any initial conditions.
It allows load flow computation and initialization of three phase networks containing machines.
The Powergui block also displays impedance versus frequency plots when Impedance Measurement blocks are present in your model.
If you own the Control System Toolbox, the Powergui block can generate the state-space model (SS) of your system and automatically opens the LTI Viewer interface for time and frequency domain responses.
Copy the Powergui block in the top level of your model and double-click on the block to open the interface.
The main menu of the Powergui block provides tools to:
- Display steady-state voltage and currents
- Display and modify initial state values
- Perform load flows and machine initialization
- Display impedance vs frequency measurements
- Use the LTI Viewer of the Control System Toolbox
- Generate a report of the steady-state calculations
Example
The Powergui block is presented here for the psbgui.mdl circuit.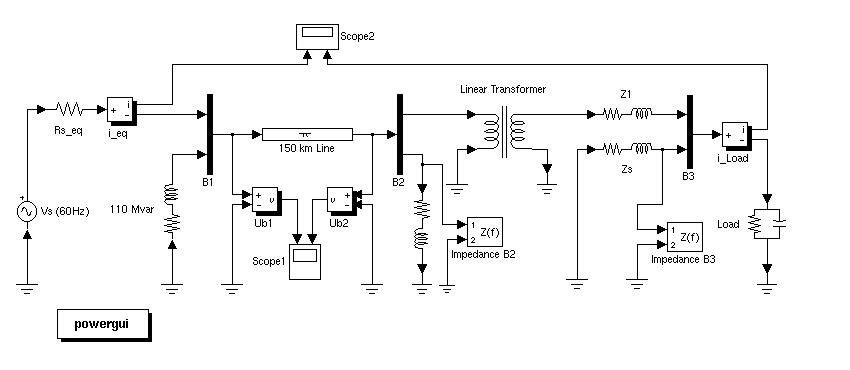
In the psbgui.mdl demo, double-click on the Powergui block to open the interface. A window named Steady-State Voltages and Currents opens.
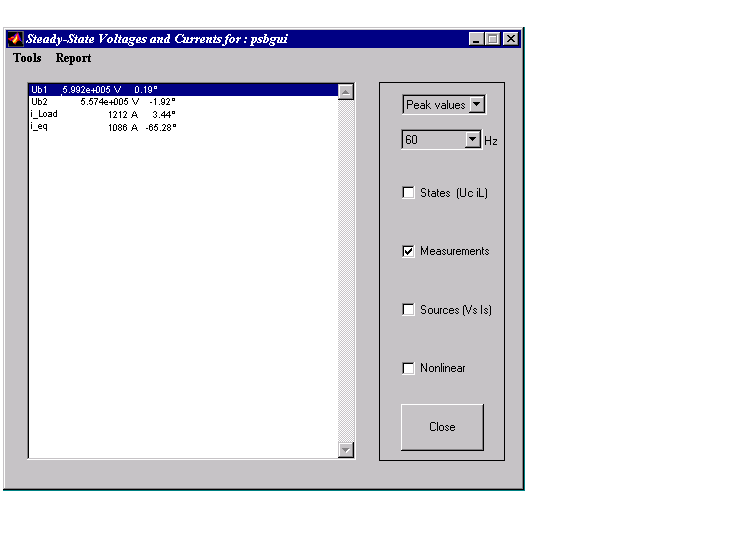
The window displays the steady-state phasor voltages and currents of the four measurements blocks of the circuit. Voltages and currents are displayed at the frequency of the Vs (60 Hz) source.
Steady-State Voltages and Currents Window
The Steady-State Voltages and Currents window contains the following parameters:
- Units
- Set the Units parameter to Peak values to display the peak values of the selected values. Set the Units parameter to RMS to display the root-mean-square (RMS) values of the selected values.
- Hz
- Allows to choose the frequency, in hertz (Hz), you are interested in to display phasors. If your circuit contains sources with different frequencies, this menu allows you to select any frequency in the list.
- States (Uc iL)
- If checked, the window displays the steady-state phasors of the capacitor voltages and inductor currents of the circuit.
- Measurements
- If checked, the window displays the steady-state phasor voltages and currents of the measurements blocks of the circuit.
- Sources (Vs Is)
- If checked, the window displays the steady-state phasor voltages of the electrical sources of the circuit.
- Nonlinear
- If checked, the window displays the steady-state voltages and currents of the nonlinear blocks of the circuit. Note that there is no nonlinear element in the model given in the example.
To display the initial state values of the state variables of the circuit, select the Initial Values of State Variables menu item in the Tools menu, then choose the Display or modify initial state values menu item. Note that from the menu you can also load initial values from a previous session or save the current initial values into a MAT-file.
Initial Values of State Variables Window
The Initial Values of State Variables that appears on your window displays the initial values of state variables.
The name of the state variables consist of the name of the block where the capacitor or the inductor is found. The name of the block is preceded by the Uc_ label for capacitor voltages and by the IL_ label for the inductor currents.
- Steady-state
- If checked, specify to the Power System Blockset to use the initial conditions for a steady-state simulation. If you have previously changed initial conditions, you will have to check the Steady State parameter in order to return to steady state initial conditions.
- Reset to zero
- Sets the initial states to zero.
- Apply
- Apply the settings to the simulation.
- Close
- Close the window.
Load Flow & Machine Initialization Window
The Load Flow & Machines Initialization window allows you to perform load flows and initialize three-phase circuits containing three-phase machines so that the simulation starts in steady-state. This option is available with network containing the following three types of machines: Simplified Synchronous Machine, Synchronous Machine, and Asynchronous Machine blocks.
Since there is no machine block in our example, we reproduce here the window displayed for the two-machine case illustrated in Session 5 of the Tutorial chapter (available in the psbmachines.mdl demo).
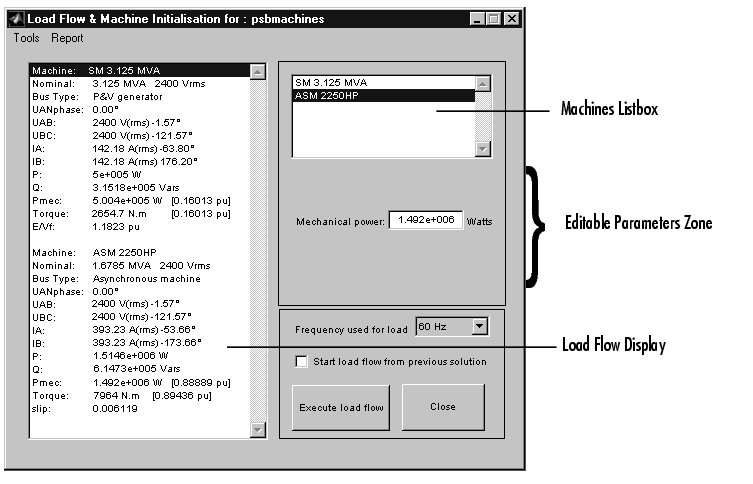
- Machines Listbox
- The Machines Listbox displays the names of the Simplified Synchronous Machines, the Synchronous Machines, and the Asynchronous Machine blocks of your circuit. Select a machine in the listbox in order to set its parameters for the desired load flow ( power and voltage, or voltage and phase).
- Editable Parameters Zone
- Depending on the type of machine you select in the Machines Listbox section, the Editable Parameters Zone displays different parameters to be set for the load flow.
- If you select a machine that is a Simplified Synchronous Machine block or a Synchronous Machine block, you will have the following editable parameters:
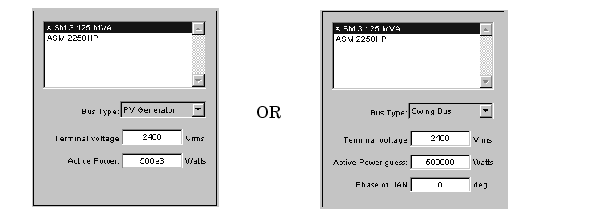
- If the Bus Type parameter is set to PV Generator, you can set the desired terminal voltage and active power of the machine. If the Bus Type parameter is set to Swing Bus, you can set the desired terminal voltage, enter an active power guess, and specify the phase of the UAN terminal voltage of the machine.
- If you select a machine that is an Asynchronous Machine block, you will only have to enter the desired mechanical power delivered by the machine.

- Frequency used for load flow
- Specifies the frequency to be used in the load flow calculations (normally 60 Hz or 50 Hz).
- Start load flow from previous solution
- If checked, the load flow will start with initial conditions corresponding to the previous load flow solution. Try this option of the load flow fails to converge.
- Execute load flow
- Executes the load flow calculations for the given load flow parameters
- Load Flow Display
- Once the load flow has been solved for the given load flow parameters, the initial conditions are automatically set in the dialog boxes of the machines and you can start the simulation in steady state.
Impedance vs Frequency Measurement Window
To perform the impedance versus frequency measurements defined by the Impedance Measurement blocks of the circuit, select the Impedance vs frequency Measurement menu item in the Tools menu.
The Impedance vs Frequency Measurement that appears on your window is as follows.
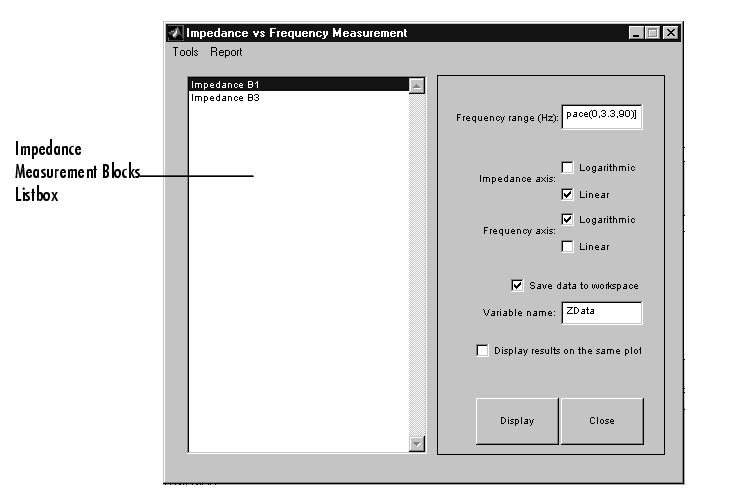
- Frequency range (Hz)
- Specifies the frequency vector, in hertz (Hz). You can specify in that field any valid MATLAB expression defining a vector of frequencies, for example
0:2:1000 or linspace(0,1000,500). The default is logspace(0,3,50).
- Impedance axis
- Defines the units of the impedance axis. Check Logarithmic or linear.
- Frequency axis
- Defines the units of the frequency axis. Check Logarithmic or linear.
- Save data to workspace
- Data can be saved in a variable in the workspace. The name of the variable is defined by the Variable name parameter.
- Display results on the same plot
- If checked, the impedance vs frequency plots will be displayed on the same plot when several Impedance Measurement blocks are used in the circuit.
- Display
- Click on the button to start the impedance vs frequency measurement and display results.
Link to the LTI Viewer Window
If you own the Control System Toolbox, you can opens the LTI viewer for time and frequency responses. To do this, select the Control System Toolbox (LTI Viewer) menu item in the Tools menu of the powergui. Your Link to LTIviewer window looks like this.
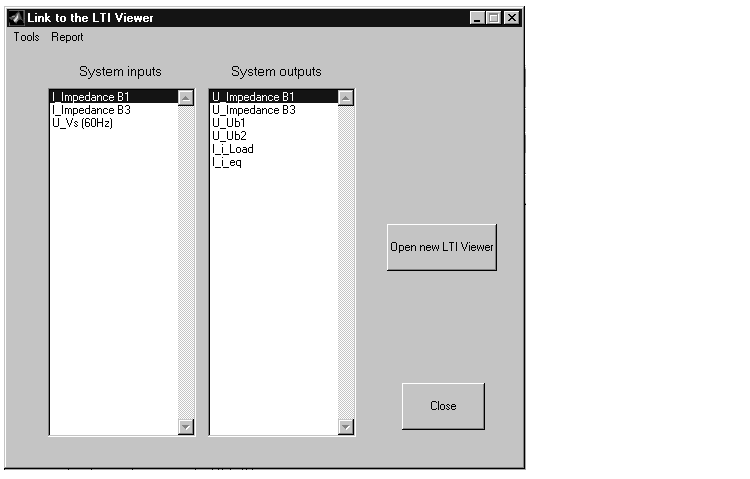
- System inputs
- Lists the inputs of the state-space equivalent system of your circuit. Select the inputs to be used by the LTI Viewer.
- System outputs
- Lists the outputs of the state-space equivalent system of your circuit. Select the outputs to be used by the LTI Viewer.
- Open new LTI Viewer
- Generate the state-space model of the circuit and opens the LTI viewer for the selected system inputs and outputs.
Generate a Report
You can generate a report of the steady-state calculations done by the Powergui block by selecting the Generate report menu item in the Report menu.
The Powergui block will generate a report in a file containing steady-state values of the measurement blocks, the sources, the nonlinear models, and the states of your circuit. The report will be saved in a file, with the extension.rep. For example the file report for the psbgui.mdl will be named psbgui.rep.
See Also
powerinit, power2sys
| | PI Section Line | | Saturable Transformer | |