
| Development Environment |   |
Viewing Profiler Results
There are two main ways to view the profiler results:
To save results, see Saving Profile Reports.
Viewing Profile Reports
To display profiler results, type
profile report
This suspends the profiler and produces three reports:
The summary report appears in your system's default Web browser. Use the links at the top of the report page to see the other reports.
Summary Profile Report
The summary report presents statistics about the overall execution and provides summary statistics for each function called. Values reported include:
Note that the profiler itself uses some time, which is included in the profiler results.
Following is the summary report for the Lotka-Volterra model described in An Example Using the Profiler.
Function Details Profile Report
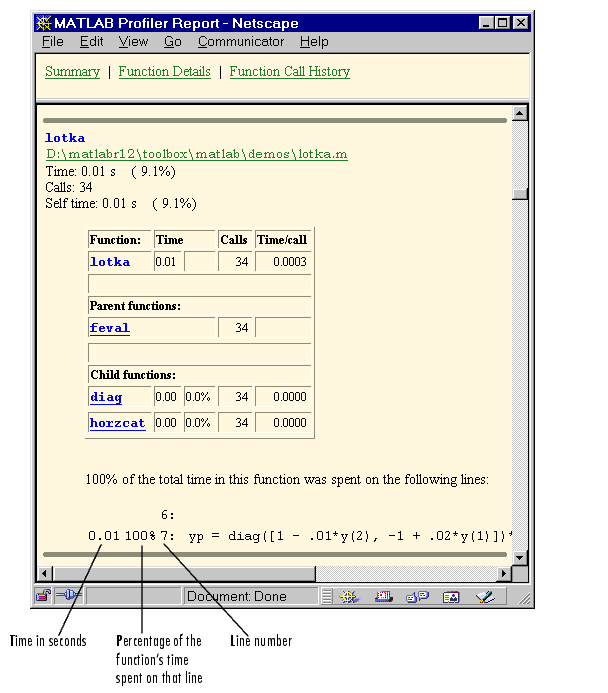
The function details report provides statistics for the parent and child functions of a function, and reports the line numbers on which the most time was spent. Following is detail report for the lotka function, which is one of the functions called in An Example Using the Profiler.

Function Call History Profile Report
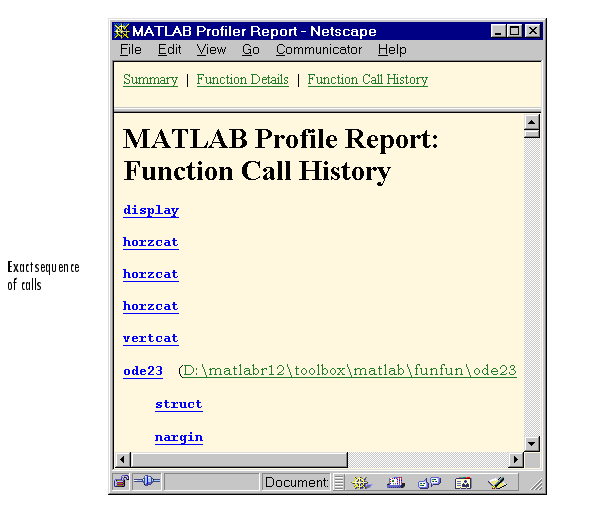
The function call history displays the exact sequence of functions called. To view this report, you must have started the profiler using the -history option.
profile on -history
The profiler records up to 10,000 function entry and exit events. For more than 10,000 events, the profiler continues to record other profile statistics, but not the sequence of calls. Following is the history report generated from An Example Using the Profiler.

 | An Example Using the Profiler | Profile Plot |  |