
| Development Environment |   |
Profile Plot
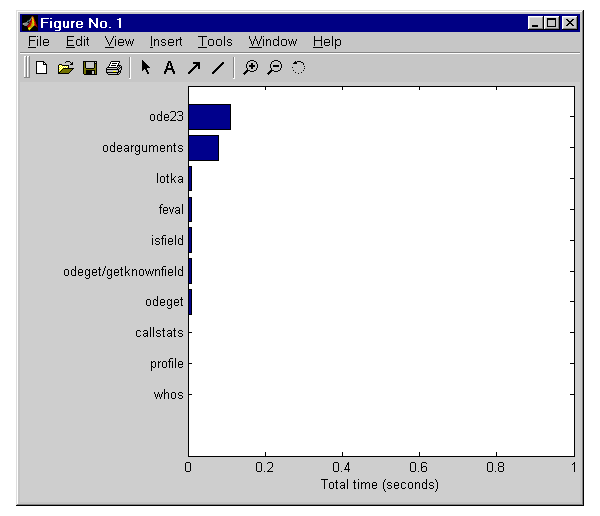
To view a bar graph for the functions using the most execution time, type
profile plot
This suspends the profiler. The bar graph appears in a figure window. Following is the bar graph generated from An Example Using the Profiler.

 | Viewing Profiler Results | Saving Profile Reports |  |