
| Graphics |   |
Adding Text Annotations to a Graph
You can add free-form text annotations anywhere in a MATLAB figure to help explain your data or bring attention to specific points in your data sets.
If you enable plot editing mode, you can create text annotations by clicking in an area of the graph or the figure background and entering text. You can also add text annotations from the command line, using the text or gtext command.
Using plot editing mode or gtext make it easy to place a text annotation anywhere in graph. Use the text command when you want to position a text annotation at a specific point in a data set.
Creating Text Annotations in Plot Editing Mode
To add a text annotation to a graph:
MATLAB changes the cursor to a text insertion cursor.
| Note After you use insert text, plot edit mode is enabled in the figure, if it was not already enabled. |
Creating Text Annotations with the text or gtext Command
To create a text annotation using the text function, you must specify the the text and its location in the graph, using x- and y-coordinates. You specify the coordinates in the units of the graph.
For example, the following code creates text annotations at specific points in the Lotka-Volterra Predator-Prey Population Model graph.
str1(1) = {'Many Predators;'};
str1(2) = {'Prey Population'};
str1(3) = {'Will Decline'};
text(7,220,str1)

str2(1) = {'Few Predators;'};
str2(2) = {'Prey Population'};
str2(3) = {'Will Increase'};
text(5.5,125,str2)
This example also illustrates how to create multi-line text annotations with cell arrays.
Calculating the Position of Text Annotations
You can also calculate the positions of text annotations in a graph. The following code adds annotations at three data points on a graph.
text(3*pi/4,sin(3*pi/4),...'\leftarrowsin(t) = .707',...'FontSize',16)text(pi,sin(pi),'\leftarrowsin(t) = 0',... 'FontSize',16) text(5*pi/4,sin(5*pi/4),'sin(t) = -.707\rightarrow',... 'HorizontalAlignment','right',... 'FontSize',16)
The HorizontalAlignment of the text string 'sin(t) = -.707 \rightarrow' is set to right to place it on the left side of the point [5*pi/4,sin(5*pi/4)] on the graph. For more information about aligning text annotations, see Text Alignment.
You can use text objects to annotate axes at arbitrary locations. MATLAB locates text in the data units of the axes. For example, suppose you plot the function  with A = 0.25,
  = 0.005, and t = 0 to 900.
t = 0:900;
plot(t,0.25*exp(-0.005*t))
To annotate the point where the value of t = 300, calculate the text coordinates using the function you are plotting.
text(300,.25*exp(-0.005*300),...
'\bullet\leftarrow\fontname{times}0.25{\ite}^{-0.005{\itt}}
'FontSize',14)
This statement defines the text Position property as x = 300,
 . The default text alignment places this point to the left of the string and centered vertically with the rectangle defined by the text
 Extent property. For information about changing this default text alignment, see the following section, "Text Alignment."
Text Alignment
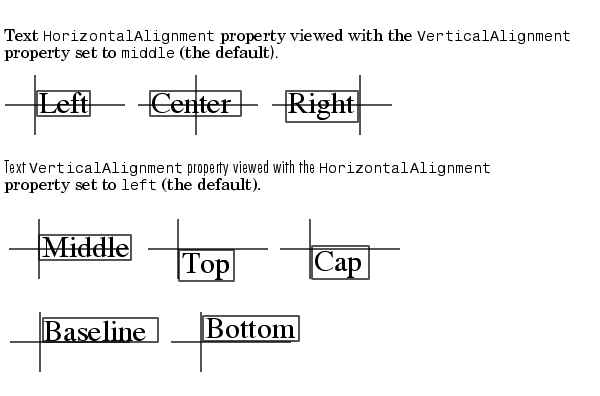
The HorizontalAlignment and the VerticalAlignment properties control the placement of the text characters with respect to the specified x-, y-, and z-coordinates. The following diagram illustrates the options for each property and the corresponding placement of the text.

HorizontalAlignment = left VerticalAlignment = middleMATLAB does not place the text String exactly on the specified Position. For example, the previous section showed a plot with a point annotated with text. Zooming in on the plot enables you to see the actual positioning of the text.
The small dot is the point specified by the text Position property. The larger dot is the bullet defined as the first character in the text String property.
 | Adding Axes Labels to a Graph | Example - Aligning Text |  |