| Graphics | |
Example - Aligning Text
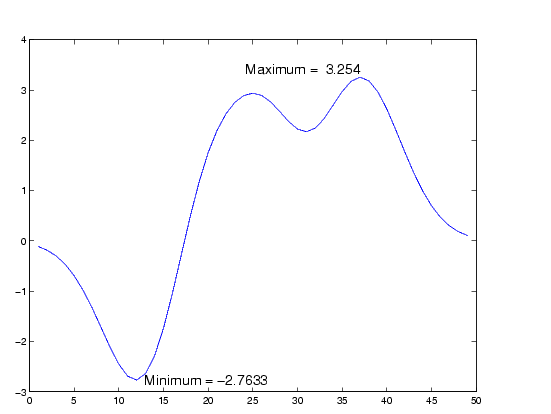
Suppose you want to label the minimum and maximum values in a plot with text that is anchored to these points and that displays the actual values. This example uses the plotted data to determine the location of the text and the values to display on the graph. One column from the peaks matrix generates the data to plot.
Z = peaks;
h = plot(Z(:,33));
The first step is to find the indices of the minimum and maximum values to determine the coordinates needed to position the text at these points (get, find). Then create the string by concatenating the values with a description of what the values are.
x = get(h,'XData'); % Get the plotted data
y = get(h,'YData');
imin = find(min(y) == y);% Find the index of the min and max
imax = find(max(y) == y);
text(x(imin),y(imin),[` Minimum = `,num2str(y(imin))],...
    `VerticalAlignment','middle',...
    `HorizontalAlignment','left',...
    'FontSize',14)
text(x(imax),y(imax),[`Maximum =  `,num2str(y(imax))],...
    `VerticalAlignment','bottom',...
    `HorizontalAlignment','right',...
    'FontSize',14)
The text function positions the string relative to the point specified by the coordinates, in accordance with the settings of the alignment properties. For the minimum value, the string appears to the right of the text position point; for the maximum value the string appears above and to the left of the text position point. The text always remains in the plane of the computer screen, regardless of the view.
Editing Text Annotations
You can edit any of the text labels or annotations in a graph:
An editing box appears around the text.
Note
To create special characters in text, such as Greek letters or
mathematical symbols, be sure to use TeX sequences - see the text command
string property. If you create special characters by using the Edit Font
Properties dialog box and selecting the Symbol font family, you will not be
able to edit that text object using MATLAB commands.
|
| | Adding Text Annotations to a Graph | Including Symbols and Greek Letters in Text Strings | |