

| Stateflow | |
Creating a Stateflow Diagram
These steps describe how to create a simple Stateflow diagram using the graphics editor:
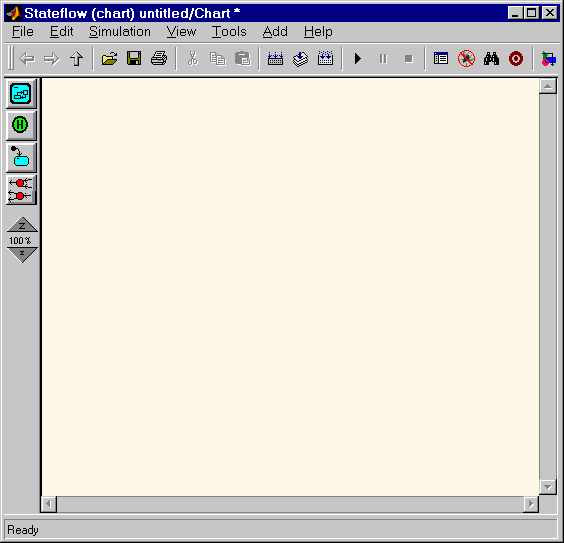
Double-click on the Stateflow block in the Simulink model window to invoke
the graphics editor window.
Click on the State button
 in the toolbar. Click in the drawing area to
place the state in the drawing area. Position the cursor over that state, click
the right mouse button, and drag to make a copy of the state. Release the
right mouse button to drop the state at that location.
in the toolbar. Click in the drawing area to
place the state in the drawing area. Position the cursor over that state, click
the right mouse button, and drag to make a copy of the state. Release the
right mouse button to drop the state at that location.
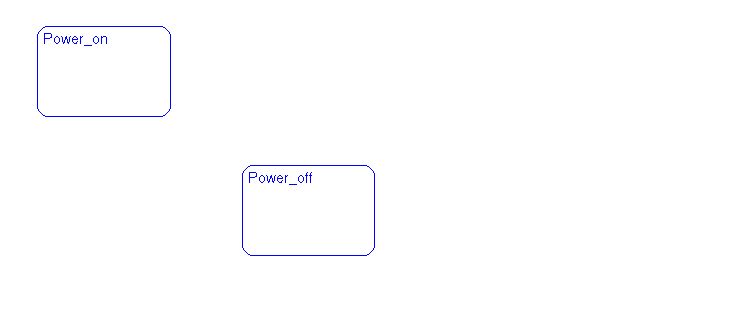
Click on the ? character within each state to enter each state label. Label the
states with the titles Power_on and Power_off. Deselect the state to exit the
edit. To deselect a state, click anywhere outside the state or press the Esc
key. Your Stateflow diagram should look similar to this sample.
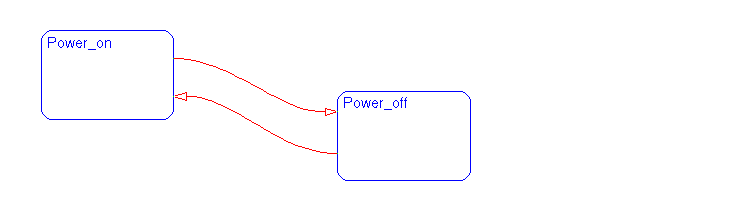
Draw a transition starting from Power_on and ending at Power_off. Place
the cursor at a straight portion of the border of the Power_on state. Click the
border when the cursor changes to a crosshair. Without releasing the mouse
button, drag the mouse to a straight portion on the border of the Power_off
state. When the transition snaps to the border of the Power_off state,
release the mouse button. (The crosshair will not appear if you place the
cursor on a corner, since corners are used for resizing.)
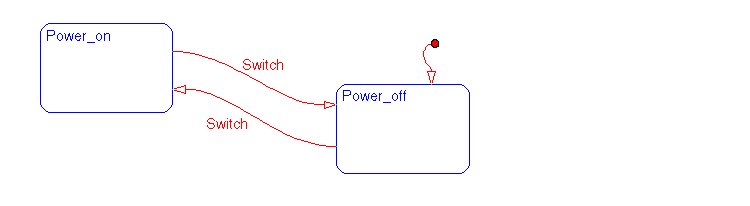
Draw another transition starting from Power_off and ending on Power_on.
Your Stateflow diagram should look similar to this sample.
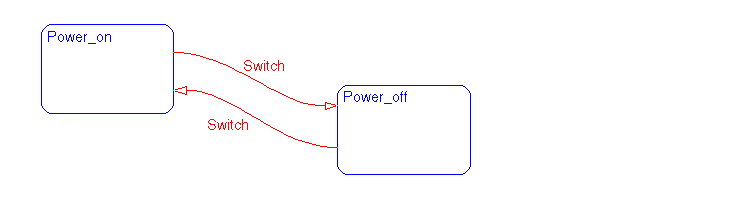
Click on the transition from Power_on to Power_off to select it. Click on the
? alongside the transition and enter the label Switch. Press the Escape key
to deselect the transition label and exit the edit.
Label the transition from Power_off to Power_on with the same text,
Switch. Your Stateflow diagram should look similar to this sample.
Click and release the mouse on the Default Transition button
 in the
toolbar. Drag the mouse to a straight portion on the border of the
in the
toolbar. Drag the mouse to a straight portion on the border of the Power_off
state. Click and release the mouse when the arrowhead snaps to the border
of the Power_off state. Your Stateflow diagram should look similar to this
sample.
For More Information
For more information on creating Stateflow diagrams using the graphics editor see Chapter 3, Creating Charts.
| | Creating a Simulink Model | Defining Input Events | |