| Spline Toolbox | |
Taylor coefficients or polynomial
Syntax
taylor = fntlr(f,dorder,x)
p = fntlr(f,dorder,x, interv)
Description
The first command returns the unnormalized Taylor coefficients at the given x of the function described in f up to the given order dorder.
For a univariate function and a scalar x, this is the vector
For a matrix x, this is the corresponding matrix in which each entry has been replaced by the corresponding Taylor vector.
For a multivariate function, the Taylor vector of order dorder becomes the Taylor array of order dorder. Assuming that the function is m-variate for some m>1, this means that dorder is expected to have length m, and the output provides, for each m-vector x(:,j) in its x input, the array of size dorder whose (i1,i2,...,im) entry is
However, the output contains this array as the equivalent vector taylor(:,j), of length d*i1*i2*...*im, with d the dimension of the target of the function f described by f.
The second command returns instead a ppform of the Taylor polynomial at x of order dorder for the function described by f. The basic interval for this ppform is as specified by interv. In this case and assuming that the function described by f is m-variate, both x is expected to be of size [m,1], and interv is either of size [m,2] or else a cell array of length m containing m vectors of size [1,2].
Examples
If f contains a univariate function and x is a scalar or a 1-row matrix, then fntlr(f,3,x) produces the same output as the statements
df = fnder(f); [fnval(f,x); fnval(df,x); fnval(fnder(df),x)];
As a more complicated example, look at the Taylor vectors of order 3 at 21 equally spaced points for the rational spline whose graph is the unit circle:
ci = rsmak('circle'); in = fnbrk(ci,'interv');
t = linspace(in(1),in(2),21); t(end)=[];
v = fntlr(ci,3,t);
We plot ci along with the points v(1:2,:), to verify that these are, indeed, points on the unit circle.
fnplt(ci), hold on, plot(v(1,:),v(2,:),'o')
Next, to verify that that v(3:4,j) is a vector tangent to the circle at the point v(1:2,j), we use MATLAB's quiver command to add the corresponding arrows to our plot:
quiver(v(1,:),v(2,:),v(3,:),v(4,:))
Finally, what about v(5:6,:)? These are second derivatives, and we add the corresponding arrows by the following quiver command, thus finishing Figure 2-1.
quiver(v(1,:),v(2,:),v(5,:),v(6,:)), axis equal, hold off
Figure 2-1: First and Second Derivative of a Rational Spline Giving a Circle
Now, our curve being a circle, you might have expected the 2nd derivative arrows to point straight to the center of that circle, and that would have been indeed the case if the function in ci had been using arclength as its independent variable. Since the parameter used is not arclength, we use the formula given at the end of the first section of the Tutorial, to compute the curvature of the curve given by ci at these selected points. For ease of comparison, we switch over to the variables used there and then simply use the commands from there.
dspt = v(3:4,:); ddspt = v(5:6,:);kappa = abs(dspt(1,:).*ddspt(2,:)-dspt(2,:).*ddspt(1,:))./...(sum(dspt.^2)).^(3/2);max(abs(kappa-1)) ans = 2.2204e-016
The numerical answer is reassuring: at all the points tested, the curvature is 1 to within roundoff.
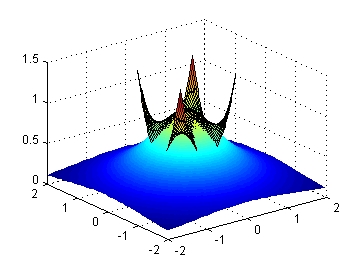
Figure 2-2: The Function 1/(1+x^2+y^2) and Its Taylor Polynomial of Order [3,3] at the Origin
As a final example, we start with a bivariate version of the Runge function, obtaining, for variety, a ppform for its denominator, 1/(1+x2+y2) by bicubic spline interpolation:
w = csapi({-1:1,-1:1},[3 2 3;2 1 2;3 2 3]);
Next, we make up the coefficient array for the numerator, 1, using exactly the same size, and put the two together into a rational spline:
wcoefs = fnbrk(w,'coef');
scoefs = zeros(size(wcoefs)); scoefs(end)=1;
runge2 = rpmak(fnbrk(w,'breaks'),[scoefs;wcoefs]);
Then we enlarge the basic interval for this rational spline, plot it and plot, on top of it, its Taylor polynomial of order [3,3] at (0,0).
fnplt(fnbrk(runge2,{[-2 2],[-2 2]}));  shading interp, hold on
fnplt(fntlr(runge2,[3 3], [0;0], [-.5 .5; -.5 .5])), hold off
Since we shaded the function but not the Taylor polynomial, we can easily distinguish the two in Figure 2-2. We can also see that, in contrast to the function, the Taylor polynomial fails to be rotationally symmetric. This is due to the fact that it is a polynomial of order [3,3] rather than a polynomial of total order 3.
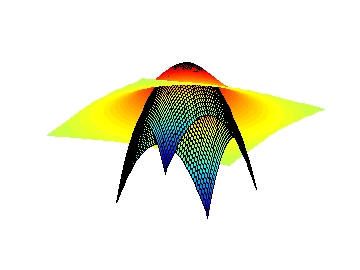
To obtain the Taylor polynomial of order 3, we get the Taylor polynomial of order [3,3], but with (0,0) the left point of its basic interval, set all its coefficients of total order bigger than 3 equal to zero, and then reconstruct the polynomial, and plot it, choosing a different view in order to show off the Taylor polynomial better. Here are the commands and the resulting Figure 2-3.
taylor = fntlr(runge2,[3 3],[0;0],[0 1;0 1]);
tcoef = fnbrk(taylor,'coe'); tcoef([1 2 4]) = 0;
taylor2 = fnbrk(ppmak(fnbrk(taylor,'br'),tcoef),{[-1 1],[-1 1]});
fnplt(fnbrk(runge2,{[-2 2],[-2 2]}));  shading interp, hold on
fnplt(taylor2), view(-28,-26), axis off, hold off
Figure 2-3: The Function 1/(1+x^2+y^2) and Its Taylor Polynomial of Order 3 at the Origin
See Also
| | fnrfn | fnval | |