

| Using Simulink |   |
Display signals generated during a simulation.
Library
Description
The Scope block displays its input with respect to simulation time. The Scope block can have multiple axes (one per port); all axes have a common time range with independent y-axes. The Scope allows you to adjust the amount of time and the range of input values displayed. You can move and resize the Scope window and you can modify the Scope's parameter values during the simulation.
When you start a simulation, Simulink does not open Scope windows, although it does write data to connected Scopes. As a result, if you open a Scope after a simulation, the Scope's input signal or signals will be displayed.
If the signal is continuous, the Scope produces a point-to-point plot. If the signal is discrete, the Scope produces a stairstep plot.
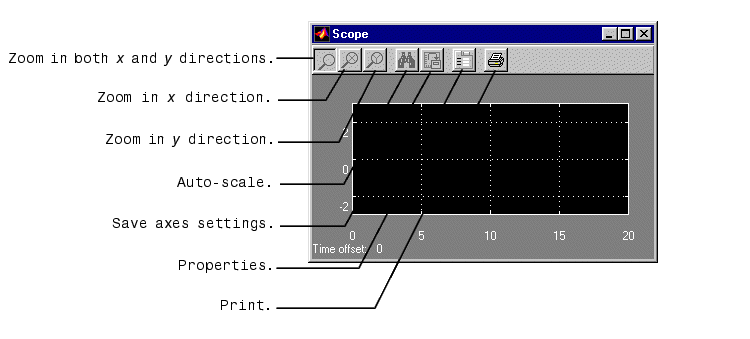
The Scope provides toolbar buttons that enable you to zoom in on displayed data, display all the data input to the Scope, preserve axes settings from one simulation to the next, limit data displayed, and save data to the workspace. The toolbar buttons are labeled in this figure, which shows the Scope window as it appears when you open a Scope block.
| Note Do not use Scope blocks inside of library blocks that you create. Instead, provide the library blocks with output ports to which scopes can be connected to display internal data. |
Displaying Vector Signals
When displaying a vector signal, the Scope uses different colors in this order: yellow, magenta, cyan, red, green, and dark blue. When more than six signals are displayed, the Scope cycles through the colors in the order listed above.
Y-Axis Limits
You set y-limits by right clicking on an axes and choosing Properties.... The following dialog box appears.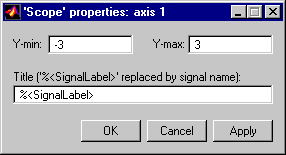
%<SignalLabel> as part of the title string (%<SignalLabel> is replaced by the signal label).Time Offset
This figure shows the Scope block displaying the output of the vdp model. The simulation was run for 40 seconds. Note that this scope shows the final 20 seconds of the simulation. The Time offset field displays the time corresponding to 0 on the horizontal axis. Thus, you have to add the offset to the fixed time range values on the x-axis to get the actual time.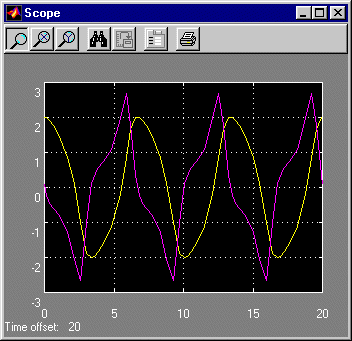
Auto-Scaling the Scope Axes
This figure shows the same output after pressing the Auto-scale toolbar button, which automatically scales both axes to display all stored simulation data. In this case, the y-axis was not scaled because it was already set to the appropriate limits.
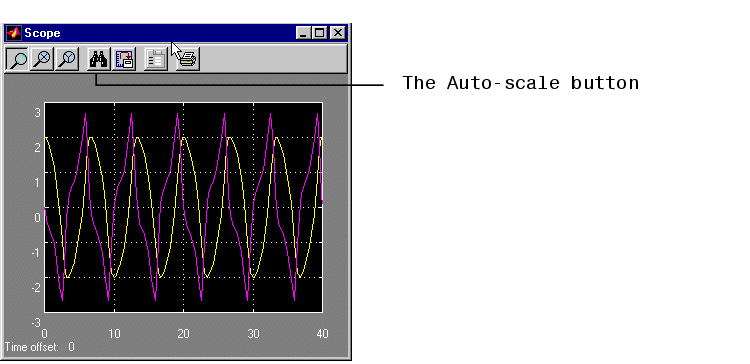
If you click on the Auto-scale button while the simulation is running, the axes are auto-scaled based on the data displayed on the current screen, and the auto-scale limits are saved as the defaults. This enables you to use the same limits for another simulation.
Zooming
You can zoom in on data in both the x and y directions at the same time, or in either direction separately. The zoom feature is not active while the simulation is running.
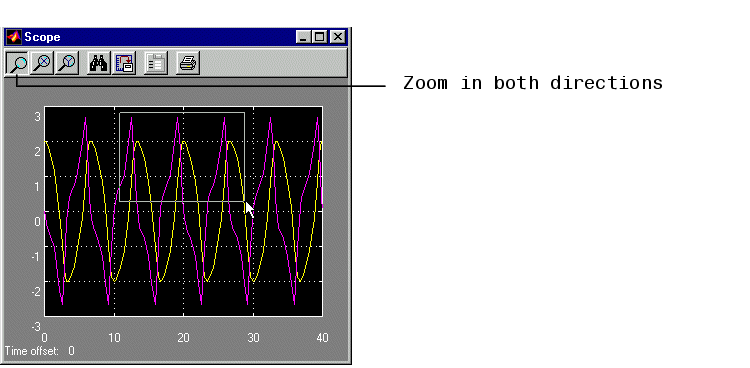
To zoom in on data in both directions at the same time, make sure the left-most Zoom toolbar button is selected. Then, define the zoom region using a bounding box. When you release the mouse button, the Scope displays the data in that area. You can also click on a point in the area you want to zoom in on.
If the scope has multiple y-axes, and you zoom in on one set of x-y axes, the x-limits on all sets of x-y axes are changed so that they match, since all x-y axes must share the same time base (x-axis).
This figure shows a region of the displayed data enclosed within a bounding box.
This figure shows the zoomed region, which appears after you release the mouse button.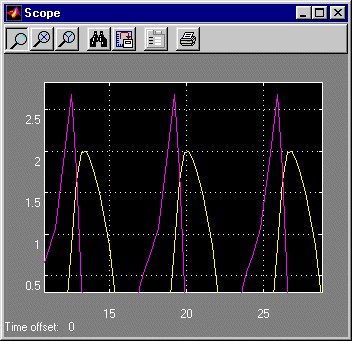
To zoom in on data in just the x direction, click on the middle Zoom toolbar button. Define the zoom region by positioning the pointer at one end of the region, pressing and holding down the mouse button, then moving the pointer to the other end of the region. This figure shows the Scope after defining the zoom region but before releasing the mouse button.
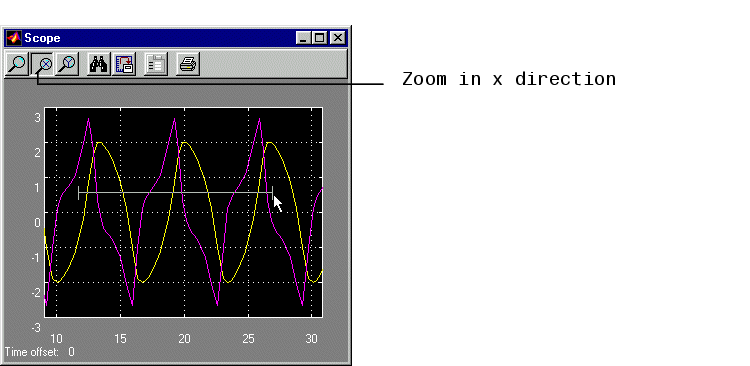
When you release the mouse button, the Scope displays the magnified region. You can also click on a point in the area you want to zoom in on.
Zooming in the y direction works the same way except that you press the right-most Zoom toolbar button before defining the zoom region. Again, you can also click on a point in the area you want to zoom in on.
Saving the Axes Settings
The Save axes settings toolbar button enables you to store the current x- and y-axis settings so you can apply them to the next simulation.

You might want to do this after zooming in on a region of the displayed data so you can see the same region in another simulation. The time range is inferred from the current x-axis limits.
Scope Properties
You can change axes limits, set the number of axes, time range, tick labels, sampling parameters, and saving options by choosing the Properties toolbar button.

When you click on the Properties button, this dialog box appears.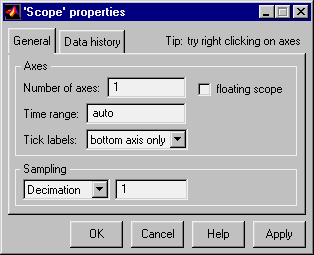
The dialog box has two tabs: General and Data history.
General Parameters
You can set the axes parameters, time range, and tick labels in the General tab. You can also choose the floating scope option with this tab.
auto in the Time range field. Entering a number of seconds causes each screen to display the amount of data that corresponds to that number of seconds. Enter auto to set the x-axis to the duration of the simulation. Do not enter variable names in these fields.Controlling Data Collection and Display
You can control the amount of data that the Scope stores and displays by setting fields on the Data History tab.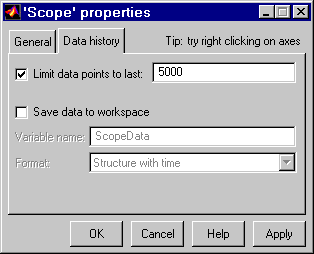
You can also choose to save data to the workspace in this tab. You apply the current parameters and options by clicking on the Apply or OK button. The values that appear in these fields are the values that will be used in the next simulation.
Array, Structure, or Structure with time. Use Array only for a Scope with one axes. For Scopes with more than one axes, use Structure if you do not want to store time data and use Structure with time if you want to store time data. Printing the Contents of a Scope Window
To print the contents of a Scope window, open the Scope Properties dialog by clicking on the Print icon, the right-most icon on the Scope toolbar.

The Signal Selector allows you to select the signals to be displayed in the floating scope. You can use it to select any signal in you model, including signals in unopened subsystems. To display the Signal Selector, first start simulation of your model with the floating scope open. Then right click your mouse in the floating scope and select Signal Selection from the popup menu that appears. The Signal Selector appears.
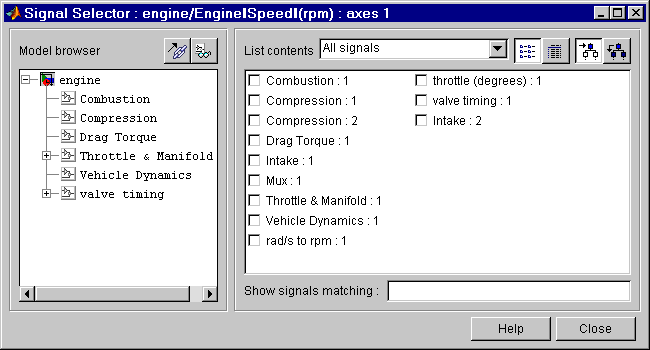
The Signal Selector contains contains two panes. The left pane allows you to display signals of any subsystem in your model. The signals appear in the right pane. The right pane allows you to select which signals to display in the floating scope.
To select a subsystem for viewing, click its entry in the Model hierarchy tree or use the up or down arrows on move the selection highlight to the entry, using the up and down arrows on your keyboard. To show or hide the subsystems contained by the currently selected subsystem, click the +/- button next to the subsystem's name or press the forward or backward arrow keys on your keyboard. To view subsystems included as library links in your model, click the Library Links button at the top of the Model hierarchy pane. To view the subsystems contained by masked subsystems, click the Look Under Masks button at the top of the pane.
The Signals pane shows all the signals in the currently selected subsystem by default. To show named signals only, select Named signals only from the List contents control at the top of the pane. To show test point signals only, select Test point signals only from the List contents control. To show only signals whose signals match a specified string of characters, enter the characters in thes Show signals matching control at the bottom of the Signals pane and press the Enter key.To show the selected types of signals for all subsystems below the currently selected subsystem in the model hierarchy, select the Current and Below button at the top of the Signals pane.
The Signals pane by default shows the name of each signal and the number of the port that emits the signal. To display more information on each signal, select the Table view button at the top of the pane. The table view shows the path and data type of each signal and whether the signal is a test point. To select or deselect a signal in the Signals pane, click its entry or use the arrow keys to move the selection highlight to the signal entry and press the Enter key. You can also move the selection highlight to a signal entry by typing the first few characters of its name (enough to uniquely identify it).
Data Type Support
A Scope block accepts real signals, including homogenous vectors, of any type.
Characteristics
| Sample Time |
Inherited from driving block or settable |
| States |
0 |
 | Saturation | Selector |  |