| Signal Processing Toolbox |
  |
Overview of the Signal Browser: Signal Analysis
You can use the Signal Browser to display and analyze signals listed in the Signals list box in SPTool.
Using the Signal Browser you can:
- Analyze and compare vector or array (matrix) signals.
- Zoom in on portions of signal data.
- Measure a variety of characteristics of signal data.
- Compare multiple signals.
- Play portions of signal data on audio hardware.
- Print signal plots.
Opening the Signal Browser
You can open the Signal Browser from SPTool by:
- Selecting one or more signals in the Signals list in SPTool
- Pressing the View button under the Signals list
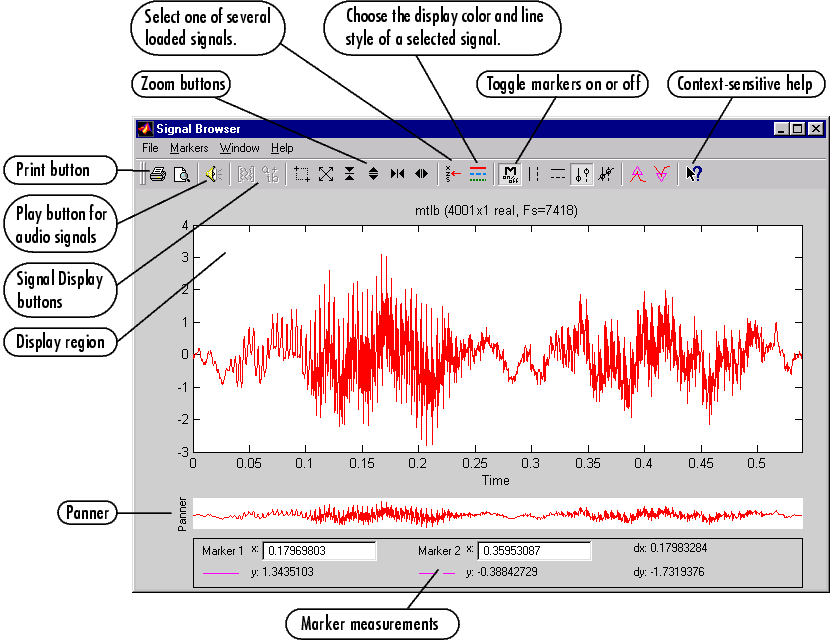
The Signal Browser has the following components:
- A display region for analyzing signals, including markers for measuring, comparing, or playing signals
- A toolbar providing convenient access to frequently used functions:
- Zoom buttons for getting a closer look at signal features
- A button for printing signal plots
- A button for playing portions of a selected signal through audio equipment
- A "panner" that displays the entire signal length, highlighting the portion currently active in the display region
| | Opening SPTool | | Overview of the Filter Designer: Filter Design | |