| Mapping Toolbox | |
Add legend labels to a map contour display
Syntax
clegendm(cs,h)
clegendm(cs,h,pos)
Description
This command will display a legend for a displayed map contour map.
clegendm(cs,h) will display a legend for the contour map defined by the two-column contour definition matrix, cs, and the handle(s) h. Both of these inputs are produced as the outputs of either contorm or contor3m.
clegendm(cs,h,pos) allows you to specify the position of the legend in the display. The input pos can be any of the following integers, with the indicated result:
0 |
Automatic placement (this is the default) |
1 |
Upper right-hand corner |
2 |
Upper left-hand corner |
3 |
Lower left-hand corner |
4 |
Lower right-hand corner |
-1 |
To the right of the plot |
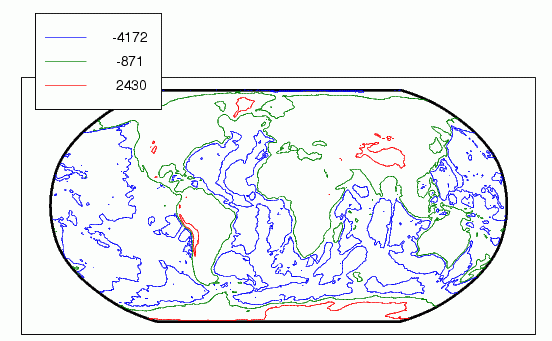
Examples
load topo
axesm robinson; framem
[cs,h] = contorm(topo,topolegend,3);
clegendm(cs,h,2)
See Also
clabelm |
Label a contour plot of map data |
contorm |
Project a contour plot of map data |
contor3m |
Project a 3-D contour plot of map data |
contourc |
Low-level contour plot computation (see online MATLAB Function Reference) |
| | clabelm | clma | |