
| MATLAB Function Reference |   |
Syntax
TRI = delaunay(x,y)
TRI = delaunay(x,y,'sorted')
Definition
Given a set of data points, the Delaunay triangulation is a set of lines connecting each point to its natural neighbors. The Delaunay triangulation is related to the Voronoi diagram-- the circle circumscribed about a Delaunay triangle has its center at the vertex of a Voronoi polygon.

Description
TRI = delaunay(x,y)
returns a set of triangles such that no data points are contained in any triangle's circumscribed circle. Each row of the m-by-3 matrix TRI defines one such triangle and contains indices into the vectors x and y.
To avoid the degeneracy of collinear data, delaunay adds some random fuzz to the data. The default fuzz standard deviation 4*sqrt(eps) has been chosen to maintain about seven digits of accuracy in the data.
tri = delaunay(x,y,fuzz)
uses the specified value for the fuzz standard deviation. It is possible that no value of fuzz produces a correct triangulation. In this unlikely situation, you need to preprocess your data to avoid collinear or nearly collinear data.
TRI = delaunay(x,y,'sorted')
assumes that the points x and y are sorted first by y and then by x and that duplicate points have already been eliminated.
Remarks
The Delaunay triangulation is used with: griddata (to interpolate scattered data), convhull, voronoi (to compute the voronoi diagram), and is useful by itself to create a triangular grid for scattered data points.
The functions dsearch and tsearch search the triangulation to find nearest neighbor points or enclosing triangles, respectively.
Note
delaunay is based on qhull [1]. For information about qhull, see http://www.geom.umn.edu/software/qhull/. For copyright information, see http://www.geom.umn.edu/software/download/COPYING.html.
|
Examples
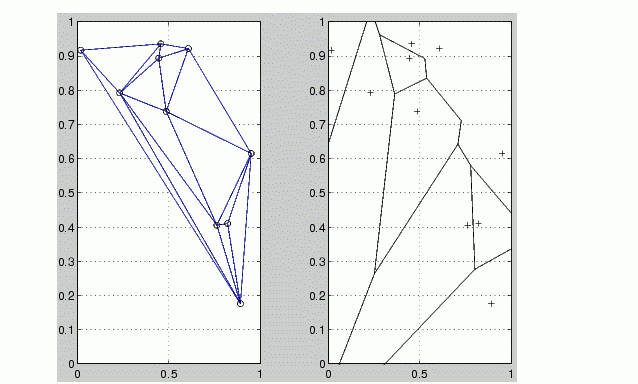
This code plots the Delaunay triangulation for 10 randomly generated points.
rand('state',0);
x = rand(1,10);
y = rand(1,10);
TRI = delaunay(x,y);
subplot(1,2,1),...
trimesh(TRI,x,y,zeros(size(x))); view(2),...
axis([0 1 0 1]); hold on;
plot(x,y,'o');
set(gca,'box','on');
Compare the Voronoi diagram of the same points:
[vx, vy] = voronoi(x,y,TRI);
subplot(1,2,2),...
plot(x,y,'r+',vx,vy,'b-'),...
axis([0 1 0 1])

See Also
convhull, delaunay3, delaunayn, dsearch, griddata, trimesh, trisurf, tsearch, voronoi, voronoin
References
[1] National Science and Technology Research Center for Computation and Visualization of Geometric Structures (The Geometry Center), University of Minnesota. 1993.
 | del2 | delaunay3 |  |