- Table of Contents
- 1. Model - vdp
- 1.1. Iteration_Value: -1
- 1.2. Iteration_Value: 0
- 1.3. Iteration_Value: 0.5
- 1.4. Iteration_Value: 1
- 1.5. Iteration_Value: 2
- 2. Post-Test Analysis
- List of Tables
- 2-1. Valid Iteration Values
Chapter 1. Model - vdp
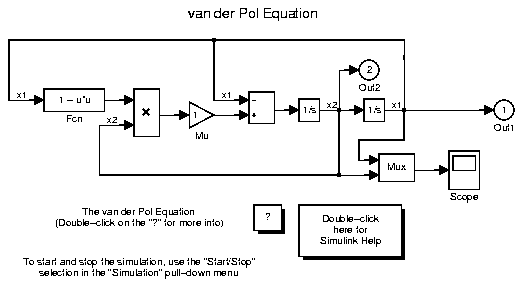
This is a demonstration of the Report Generator's ability to experiment with Simulink systems and auto-document the results. In this report, we will load the model vdp and simulate it 5 times. The report will modify the vdp/Mu block's "Gain" value, setting it to the values [-1 0 0.5 1 2]. Each iteration of the test will include a set of scope snapshots in the report.
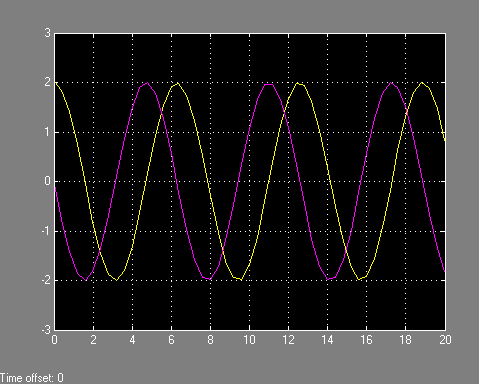
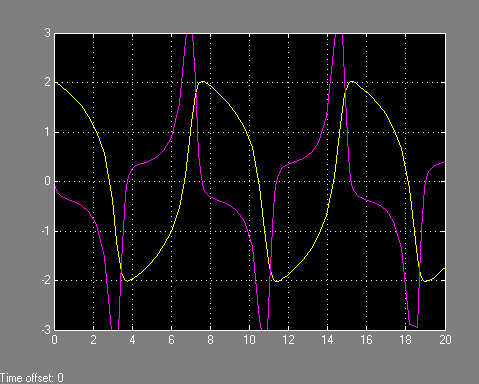
1.3. Iteration_Value: 0.5
Success! The conditioned signal has a maximum value of 2.20114, which lies in the desired range of greater than 2.1 and less than 3.
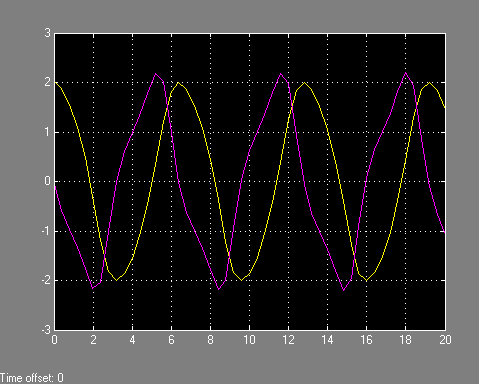
1.4. Iteration_Value: 1
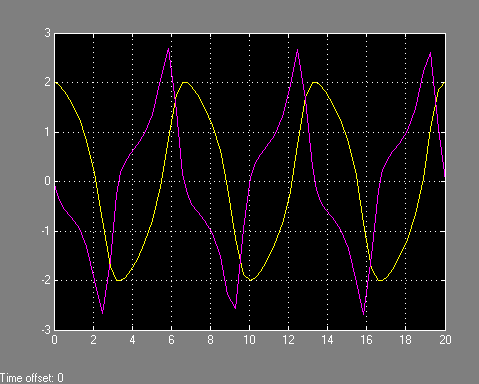
Success! The conditioned signal has a maximum value of 2.67741, which lies in the desired range of greater than 2.1 and less than 3.
Chapter 2. Post-Test Analysis
2 values for vdp/Mu were found which resulted in a maximum signal value greater than 2.1 but less than 3. The following table shows those values and their resulting signal maximum.