| Wavelet Toolbox | |
Generate noisy wavelet test data.
Syntax
X = wnoise(FUN,N)
[X,XN] = wnoise(FUN,N,SQRT_SNR)
[X,XN] = wnoise(FUN,N,SQRT_SNR,INIT)
Description
X = wnoise(FUN,N) returns values of the test signal given by FUN, on a 2N grid of [0,1].
[X,XN] = wnoise(FUN,N,SQRT_SNR) returns a test vector X as above, rescaled such that std(X) = SQRT_SNR. The returned vector XN contains the same test vector corrupted by additive Gaussian white noise N(0,1). Then, XN has a signal-to-noise ratio of SNR = (SQRT_SNR)2.
[X,XN] = wnoise(FUN,N,SQRT_SNR,INIT) returns previous vectors X and XN, but the generator seed is set to INIT value.
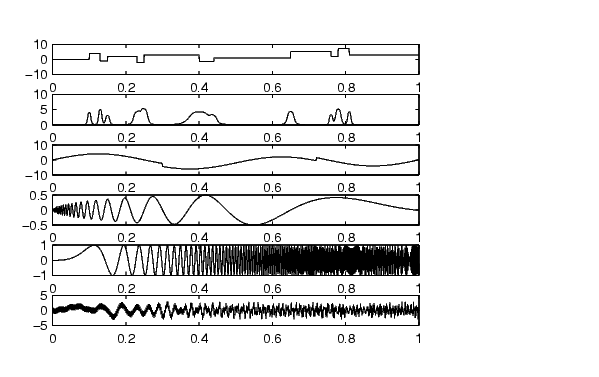
The six functions below are due to Donoho and Johnstone (See "References").
| FUN = 1 or |
'blocks' |
| FUN = 2 or |
'bumps' |
| FUN = 3 or |
'heavy sine' |
| FUN = 4 or |
'doppler' |
| FUN = 5 or |
'quadchirp' |
| FUN = 6 or |
'mishmash' |
Examples
% Generate 2^10 samples of 'Heavy sine' (item 3).
x = wnoise(3,10);

% Generate 2^10 samples of 'Doppler' (item 4) and of
% noisy 'Doppler' with a square root of signal-to-noise
% ratio equal to 7.
[x,noisyx] = wnoise(4,10,7);

% To introduce your own rand seed, a fourth
% argument is allowed:
init = 2055415866;
[x,noisyx] = wnoise(4,10,7,init);

% Plot all the test functions.
ind = linspace(0,1,2^10);
for i = 1:6
    x = wnoise(i,10);
    subplot(6,1,i), plot(ind,x)
end

% Editing some graphical properties,
% the following figure is generated.
See Also
wden
References
Donoho, D.L.; I.M. Johnstone (1994), "Ideal spatial adaptation by wavelet shrinkage," Biometrika, vol 81, pp. 425-455.
Donoho, D.L.; I.M. Johnstone (1995), "Adapting to unknown smoothness via wavelet shrinkage via wavelet shrinkage," JASA, vol 90, 432, pp. 1200-1224.
| | wmaxlev | wnoisest | |