
| Symbolic Math Toolbox |   |
Syntax
ezplot3(x,y,z)
ezplot3(x,y,z,[tmin,tmax])
ezplot3(...,'animate')
Description
ezplot3(x,y,z) plots the spatial curve x = x(t), y = y(t), and z = z(t) over the default domain  .
.
ezplot3(x,y,z,[tmin,tmax]) plots the curve x = x(t), y = y(t), and z = z(t) over the domain tmin < t < tmax.
ezplot3(...,'animate') produces an animated trace of the spatial curve.
Examples
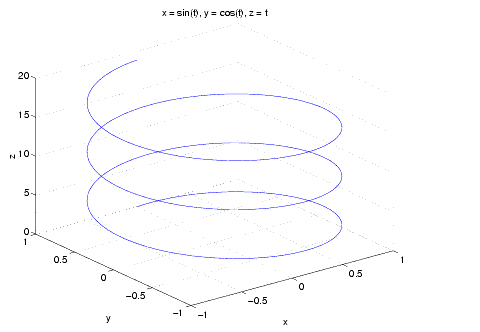
This example plots the parametric curve,


syms t; ezplot3(sin(t), cos(t), t,[0,6*pi])

See Also
ezcontour, ezcontourf, ezmesh, ezmeshc, ezplot, ezpolar, ezsurf, ezsurfc, plot3
 | ezplot | ezpolar |  |