| Statistics Toolbox | |
Example: Multivariate Analysis of Variance
The carsmall data set has measurements on a variety of car models from the years 1970, 1976, and 1982. Suppose we are interested in whether the characteristics of the cars have changed over time.
load carsmall
whos
Name               Size         Bytes  Class
  Acceleration     100x1            800  double array
  Cylinders        100x1            800  double array
  Displacement     100x1            800  double array
  Horsepower       100x1            800  double array
  MPG              100x1            800  double array
  Model            100x36          7200  char array
  Model_Year       100x1            800  double array
  Origin           100x7           1400  char array
  Weight           100x1            800  double array
Four of these variables (Acceleration, Displacement, Horsepower, and MPG) are continuous measurements on individual car models. The variable Model_Year indicates the year in which the car was made. We can create a grouped plot matrix of these variables using the gplotmatrix function.
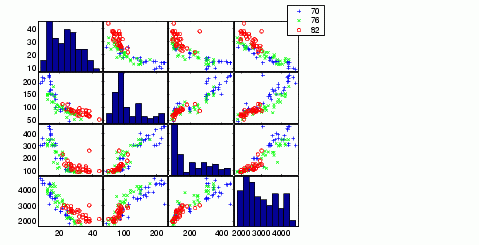
x = [MPG Horsepower Displacement Weight];
gplotmatrix(x,[],Model_Year,[],'+xo')
(When the second argument of gplotmatrix is empty, the function graphs the columns of the x argument against each other, and places histograms along the diagonals. The empty fourth argument produces a graph with the default colors. The fifth argument controls the symbols used to distinguish between groups.)
It appears the cars do differ from year to year. The upper right plot, for example, is a graph of MPG versus Weight. The 1982 cars appear to have higher mileage than the older cars, and they appear to weigh less on average. But as a group, are the three years significantly different from one another? The manova1 function can answer that question.
[d,p,stats] = manova1(x,Model_Year)
d =
     2
p =
  1.0e-006 *
         0
    0.1141
stats =
           W: [4x4 double]
           B: [4x4 double]
           T: [4x4 double]
         dfW: 90
         dfB: 2
         dfT: 92
      lambda: [2x1 double]
       chisq: [2x1 double]
     chisqdf: [2x1 double]
    eigenval: [4x1 double]
    eigenvec: [4x4 double]
       canon: [100x4 double]
       mdist: [100x1 double]
      gmdist: [3x3 double]
The manova1 function produces three outputs:
d, is an estimate of the dimension of the group means. If the means were all the same, the dimension would be 0, indicating that the means are at the same point. If the means differed but fell along a line, the dimension would be 1. In the example the dimension is 2, indicating that the group means fall in a plane but not along a line. This is the largest possible dimension for the means of three groups.p, is a vector of p-values for a sequence of tests. The first p-value tests whether the dimension is 0, the next whether the dimension is 1, and so on. In this case both p-values are small. That's why the estimated dimension is 2.stats, is a structure containing several fields, described in the following section.| | Multivariate Analysis of Variance (MANOVA) | The Fields of the stats Structure | |