| Stateflow |
  |
Debugging
The Stateflow Debugger supports functions like single stepping, animating, and running up to a designated breakpoint and then stopping.
These steps show how to step through the simulation using the Debugger:
- Display the Debugger by choosing Debug from the Tools menu of the graphics editor.
- Click on the Breakpoints: Chart Entry check box to specify you want the Debugger to stop the simulation execution when the chart is entered.
- Click on the Start button to start the simulation. Informational and error messages related to the S-function code generation for Stateflow blocks are displayed in the MATLAB command window. When the target is built, the graphics editor becomes read-only (frozen) and the Debugger window will be updated and look similar to this.
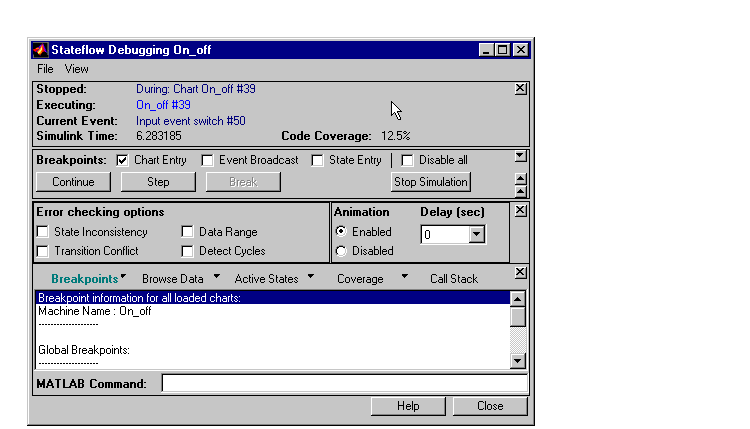
- Click on the Step button to proceed one step at a time through the simulation. The Debugger window displays the following information:
- Where the simulation is stopped
- What is executing
- The current event
- The simulation time
- The current code coverage percentage
Watch the graphics editor window as you click on the Step button to see each
transition and state animated when it is executing. After both Power_off
and Power_on have become active by stepping through the simulation, the
code coverage indicates 100%.
- Choose Stop from the graphics editor Simulation menu to stop a simulation. Once the simulation stops, the model becomes editable.
- Click on the Close button in the Debugger window.
- Choose Close from the File menu in the Simulink model window.
For More Information
See Chapter 10, Debugging for more information beyond the debugging topics in this section.
| | Running a Simulation | | Generating Code | |