
| Using Simulink |   |
Simulation Diagnostics Dialog Box
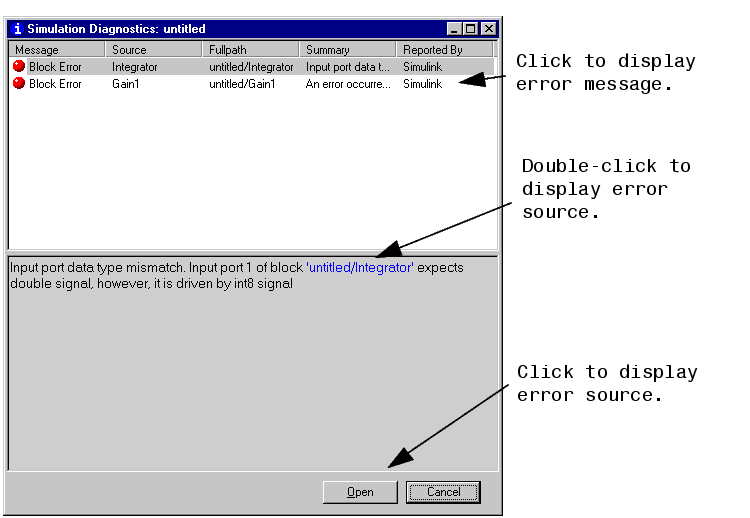
If errors occur during a simulation, Simulink halts the simulation and displays the errors in the Simulation Diagnostics dialog box.

The dialog box has two panes. The upper pane consist of columns that display the following information for each error.
Message. Message type (for example, block error, warning, log)
Source. Name of the model element (for example, a block) that caused the error.
Fullpath. Path of the element that caused the error.
Summary. Error message abbreviated to fit in the column.
Reported by. Component that reported the error (for example, Simulink, Stateflow, Real-Time Workshop, etc.).
The lower pane initially contains the full content of the first error message listed in the top pane. You can display the content of other messages by single-clicking on their entries in the upper pane.
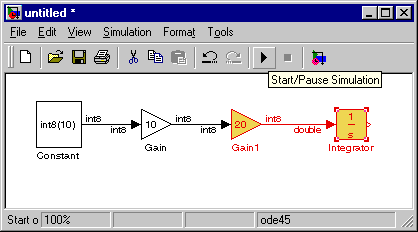
In addition to displaying the Simulation Diagnostics dialog box, Simulink also opens (if necessary) the diagram that contains the error source and highlights the source.
You can similarly display other error sources by double-clicking on the corresponding error message in the top pane, by double-clicking on the name of the error source in the error message (highlighted in blue), or by selecting the Open button on the dialog box.
 | Starting the Simulation | The Simulation Parameters Dialog Box |  |