| Signal Processing Toolbox |
  |
Opening the Spectrum Viewer
To open the Spectrum Viewer and create a PSD estimate from SPTool:
- Select a signal from the Signal list box in SPTool.
- Press the Create button in the Spectra list.
- Press the Apply button in the Spectrum Viewer.
To open the Spectrum Viewer with a PSD estimate already listed in SPTool:
- Select a PSD estimate from the Spectra list box in SPTool.
- Press the View button in the Spectra list.
For example:
- Select
mtlb in the default Signals list in SPTool.
- Press the Create button in SPTool to open the Spectrum Viewer.
- Press the Apply button in the Spectrum Viewer to plot the spectrum
 .
.
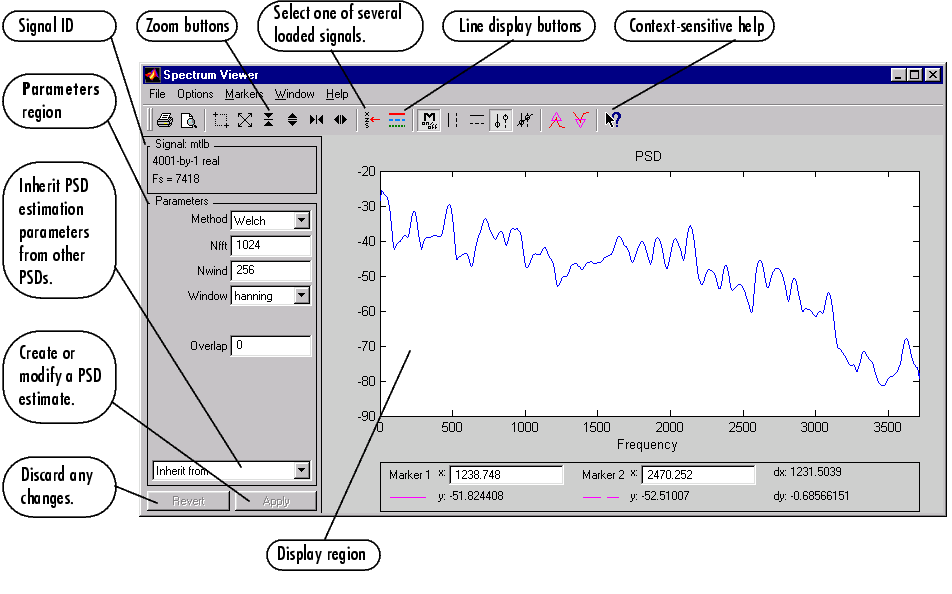
The Spectrum Viewer has the following components:
- A signal identification region that provides information about the signal whose power spectral density estimate is displayed
- A Parameters region for modifying the PSD parameters
- A display region for analyzing spectra
- Zoom buttons for navigating plotted spectra
- Marker buttons and line-display buttons for making spectral measurements and comparisons
- Spectrum management controls:
- Inherit from menu to inherit PSD specifications from another PSD object listed in the menu
- Revert button to revert to the named PSD's original specifications
- Apply button for creating or updating PSD estimates
- Menu options for modifying plot display characteristics
- Menu options and buttons for printing PSD plots
 | Overview of the Spectrum Viewer: Spectral Analysis | | Getting Help |  |


 .
.

