
| Model Predictive Control Toolbox |   |
Determines impulse response coefficients for a multi-input single-output system via Multivariable Least Squares Regression or Ridge Regression.
Syntax
[theta,yres] =mlr(xreg,yreg,ninput) [theta,yres] =mlr(xreg,yreg,ninput,plotopt,wtheta, ...
wdeltheta)
Description
xreg and yreg are the input matrix and output vector produced by routines such as wrtreg. ninput is number of inputs. Least Squares is used to determine the impulse response coefficient matrix, theta. Columns of theta correspond to impulse response coefficients from each input. Optional output yres is the vector of residuals, the difference between the actual outputs and the predicted outputs.
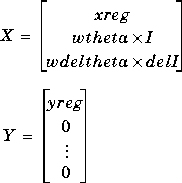
plotopt, wtheta, and wdeltheta. No plot is produced if plotopt is equal to 0 which is the default; a plot of the actual output and the predicted output is produced if plotopt=1; two plots -- plot of actual and predicted output, and plot of residuals -- are produced for plotopt=2. Penalties on the squares of theta and the changes in theta can be specified through the scalar weights wtheta and wdeltheta, respectively (defaults are 0). theta is calculated as follows:
theta1 = (XTX)-1XTY
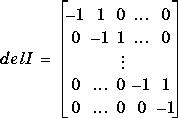
where

where I is identity matrix of dimension n * nu

dimension of delI is n * nu by n * nu.
then
Example
Consider the following two-input single-output system:

Load the input and output data. The input and output data were generated from the above transfer function and random zero-mean noise was added to the output. Sampling time of 7 minutes was used.
load mlrdat;Determine the standard deviations for input data using the function
autosc.
[ax,mx,stdx] = autosc(x);Scale the input data by their standard deviations only.
mx = [0,0];
sx = scal(x,mx,stdx);
Put the input and output data in a form such that they can be used to determine the impulse response coefficients. 35 impulse response coefficients (
n) are used.
n = 35; [Determine the impulse response coefficients viaxreg,yreg] =wrtreg(sx,y,n);
mlr. By specifying plotopt=2, two plots -- plot of predicted output and actual output, and plot of the output residual (or predicted error) -- are produced.
Scaleninput= 2;plotopt= 2; [theta,yres] =mlr(xreg,yreg,ninput,plotopt);
theta based on the standard deviations used in scaling the input.
theta = scal(theta,mx,stdx);Convert the impulse model to a step model to be used in MPC design. Recall that a sampling time of 7 minutes was used in determining the impulse model. Number of outputs (1 in this case) must be specified.
Plot the step response coefficients.nout= 1;delt= 7; model =imp2step(delt,nout,theta);
plotstep(model)
See Also
plsr, validmod, wrtreg
 | imp2step | mod format |  |