

| System Identification | |
Plot a variety of model characteristics (requires the Control System Toolbox).
Syntax
plot(m)
plot(m('n'))
plot(m1,...,mN,Plottype)
plot(m1,PlotStyle1,...,mN,PlotStyleN)
Description
m is the output-input data to be graphed, given as any idfrd or idmodel object. After appropriate model transformations, the LTI Viewer of the Control System Toolbox is invoked. This allows e.g., bode, nyquist, impulse, step, zero/poles plots.
To compare several models m1,...,mN, use plot(m1,...,mN). With PlotStyle, the color, linestyle and marker, of each model can be specified.
plot(m1,'y:*',m2,'b')
Adding Plottype as a last argument specifies the type of plot in which plot is initialized. Plottype is any of 'impulse', 'step', 'bode', 'nyquist', 'nichols', 'sigma', or 'pzmap'. It can also be given as a cell array containing any collection of these strings (up to 6) in which case a multiplot is shown.
plot will not display confidence regions. For that use bode, nyquist, impulse, step, and pzmap.
The noise input channels in m are treated as follows: Consider a model m with both measured input channels u (nu channels) and noise channels e (ny channels) with covariance matrix 
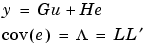
where L is a lower triangular matrix. Note that m.NoiseVariance =  . The model can also be described with unit variance, normalized noise source v:
plot(m) plots the characteristics of the transfer function G.plot(m('n')) plots the characteristics of the transfer function HL. (ny inputs and ny outputs).The input channels have names v@yname, where yname is the name of the corresponding output.m is a time series, that is nu = 0, plot(m) plots the characteristics of the transfer function HL.plot(noisecnv(m)) plots the characteristics of the transfer function [G H] (nu+ny inputs and ny outputs). The noise input channels have names e@yname, where yname is the name of the corresponding output.plot(noisecnv(m,'norm')) plots the characteristics of the transfer function [G HL] (nu+ny inputs and ny outputs. The noise input channels have names v@yname, where yname is the name of the corresponding output.plot does not give access to all of the features of ltiview. Use
ml = ss(m), ltiview(Plottype,ml,...)
See Also
bode, impulse, nyquist, step, pzmap
| | plot (iddata) | polydata | |