| Release 11 New Features |
Visualization Enhancements
Figure Window Enhancements
Accessing Off-Screen Visible Figures
You can use the newfindfigs function to find all visible figures that are positioned completely off-screen and make them visible on screen, at the top left corner of the screen.
New Menu Items in the Figure Window
When you create a plot, the File menu in the figure window now includes three new items:New Toolbar in Figure Window
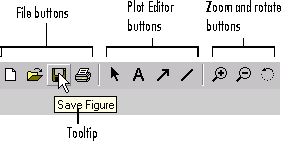
When you create a plot, the figure window now includes a toolbar for quick access to popular features that also appear in the File menu. Position the cursor over a button, and a tooltip describing that feature appears. .
The zoom in and out buttons allow you magnify or reduce the size of the figure. For 2-D plots, the zoom buttons use the zoom command, and for 3-D plots, they use the camzoom command.
rotate3d command.
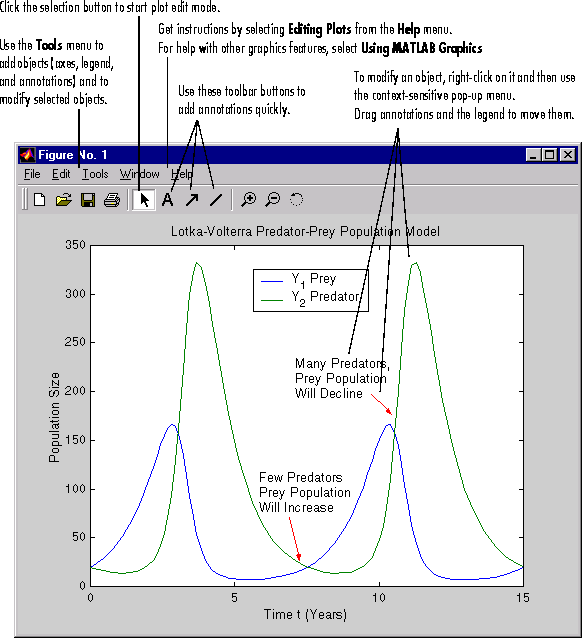
The Plot Editor is an easy-to-use tool you use to add and modify:
The Plot Editor
This illustration shows the main features of the Plot Editor.
New Context-Sensitive Help
There is a new form of help available for the dialog boxes in the Plot Editor and the Page Setup dialog box. For these dialog boxes, click the Help button in a dialog box to go directly to help for that dialog box. See the "Online Documentation Enhancements" earlier in this chapter for details about context-sensitive help.New Look for the PrintFrame Editor
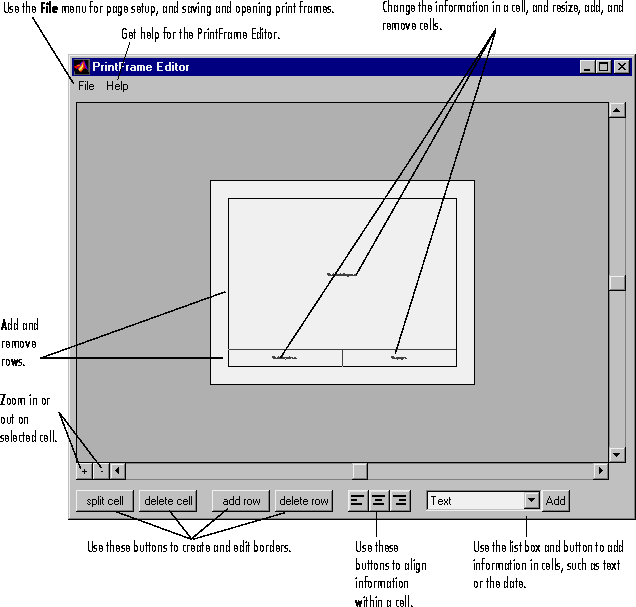
While the functionality for the PrintFrame Editor has not changed, its user interface has a new look. In addition, help for the PrintFrame Editor now is available directly from the Help menu. To access the PrintFrame Editor, use theframeedit command.
Support for HDF/EOS Development Tools
MATLAB 5.3 provides three additional functions that act as gateways to the Hierarchical Data Format/Earth Observing System (HDF/EOS), for grid, point, and swath objects. HDF/EOS, an extension of the NCSA (National Center for Supercomputing Applications) HDF standard, is the scientific data format standard selected by NASA as the baseline standard for EOS. The functions in the HDF-EOS C library are developed and maintained by EOSDIS (Earth Observing System Data and Information System). The new MATLAB functions are listed below.| Function |
Description |
hdfgd |
HDF-EOS GD (grid) interface |
hdfpt |
HDF-EOS PT (point) interface |
hdfsw |
HDF-EOS SW (swath) interface |
http://hdfeos.gsfc.nasa.gov. If you are unable to obtain the document from this location, please contact MathWorks Technical Support (support@mathworks.com).
New Histogram Function
You can use the newhistc function for binning vector elements. histc differs from the hist function in that it uses bin edges to define the bins. The output vector can be plotted with the bar function.
New Plotting Functions
MATLAB 5.3 provides a set of new plotting functions to graph mathematical expressions. Key features of these functions include:| Function |
Purpose |
ezcontour |
Contour plotter |
ezcontourf |
Filled contour plotter |
ezmesh |
3-D mesh plotter |
ezmeshc |
Combination mesh/contour plotter |
ezplot |
Function plotter |
ezplot3 |
3-D parametric curve plotter |
ezpolar |
Polar coordinate plotter |
ezsurf |
3-D colored surface plotter |
ezsurfc |
Combination surf/contour plotter |
New Volume Visualization Functions
MATLAB supports a set of new functions for visualizing 3-D scalar and vector data.| Function |
Purpose |
coneplot |
Plot velocity vectors as cones in a 3-D vector field |
contourslice |
Draw contours in volume slice planes |
isocaps |
Compute isosurface end-cap geometry |
isonormals |
Compute normals of isosurface vertices |
isosurface |
Extract isosurface data from volume data |
reducepatch |
Reduce the number of patch faces |
reducevolume |
Reduce the number of elements in a volume data set |
shrinkfaces |
Reduce the size of patch faces |
smooth3 |
Smooth 3-D data |
stream2 |
Compute 2-D stream line data |
stream3 |
Compute 3-D stream line data |
streamline |
Draw stream lines from 2-D or 3-D vector data |
surf2patch |
Convert surface data to patch data |
subvolume |
Extract subset of volume data set |
findobj More Flexible
Thefindobj function now accepts any property value that is allowed with set. For example,
findobj('Type','line','Color',[1 0 0])
can now be written
findobj('Type','line','Color','r')
Rectangle Object Added
MATLAB 5.3 adds a new rectangle Handle Graphics object. Use therectangle function to create a rectangle object.
legend Enhancements
MATLAB 5.3 enhances thelegend function to:
New Figure Properties
DoubleBuffer Figure Property
Figure objects have a new property calledDoubleBuffer, which accepts the values on and off, with off being the default. Double buffering works only when the figure Renderer property is set to painters.
Double buffering is the process of drawing to an off-screen pixel buffer and then displaying (blitting) the buffer contents on the screen once the drawing is complete. Double buffering generally produces flash-free rendering for simple animations (such as those involving lines, as opposed to objects containing large numbers of polygons). Use double buffering with the animated objects' EraseMode property set to normal. Use the set command to enable double buffering:
set(figure_handle,'DoubleBuffer','on')
XDisplay, XVisual, XVisualMode Properties - UNIX Only
XDisplay. You can display a figure window on a different display using theXDisplay property. For example, to display the current figure on a system called fred, use the command:
set(gcf,'XDisplay','fred:0.0')XVisual. You can select the visual used by MATLAB by setting the
XVisual property to the desired visual ID.
This can be useful if you want to test your application on an 8-bit or grayscale visual. To see what visuals are available on your system, use the UNIX xdpyinfo command. From MATLAB type:
!xdpyinfoThe information returned contains a line specifying the visual ID. For example:
visual id: 0x21To use this visual with the current figure, set the
XVisual property to the ID:
set(gcf,'XVisual','0x21')XVisualMode.
XVisualMode can take on two values - auto (the default) and manual. In auto mode, MATLAB selects the best visual to use based on the number of colors, availability of the OpenGL extension, etc. In manual mode, MATLAB does not change the visual from the one currently in use. Setting the XVisual property sets this property to manual.
New FontName Property Value
The text and axesFontName properties accept a new value of fixedwidth. When FontName is set to fixedwidth, MATLAB uses the font name defined by the new root property FixedWidthFontName, which is Courier by default.
uint16 CData for Images
You can now define images withCData of class uint16.
Support for Portable Network Graphics Images
MATLAB can read or write images stored in the Portable Network Graphics (PNG) format. Theimread, imwrite, and imfinfo functions can now handle files stored in any of the following PNG formats: