
Global Pattern of Temperature and Rainfall
Fig. 1
Schematic depiction of the major climate belts on Earth.
If we look at the climate of Planet Earth without going into very much detail, we can see a number of very basic features that seem to depend only upon latitude, as sketched in Fig. 1:
- an equatorial rain belt, the Intertropical Convergence Zone (ITCZ), which shows up clearly in the annual mean rainfall (the blues and purples in Fig. 2), as well as on satellite images of clouds (see the equatorial band of clouds in Fig 4)
- the tradewind belts (northeasterly trades in the Northern Hemisphere and southeasterly trades in the Southern Hemisphere), flanking the equatorial rain belt (Fig. 3),
- the subtropical deserts (indicated by the yellows and browns in Fig. 2)
- the midlatitude westerly belts (Fig. 3) which are disturbed by an unending sequence of disturbances called extratropical cyclones. We viewed an extratropical cyclone over the North Pacific on the web in class (Fig 5). To see what's out there now, check out the visible and infrared satellite imagery on the departmental web site at: http://www.atmos.washington.edu/data/weather.html#satellite.
Fig. 2
Annual mean rainfall based on station data over land and infrared satellite
imagery over the sea. For
monthly mean maps and animations see
http://tao.atmos.washington.edu/legates_msu/index.html
Fig. 3 Annual-mean
surface winds over based on the NCEP/NCAR Reanalyses
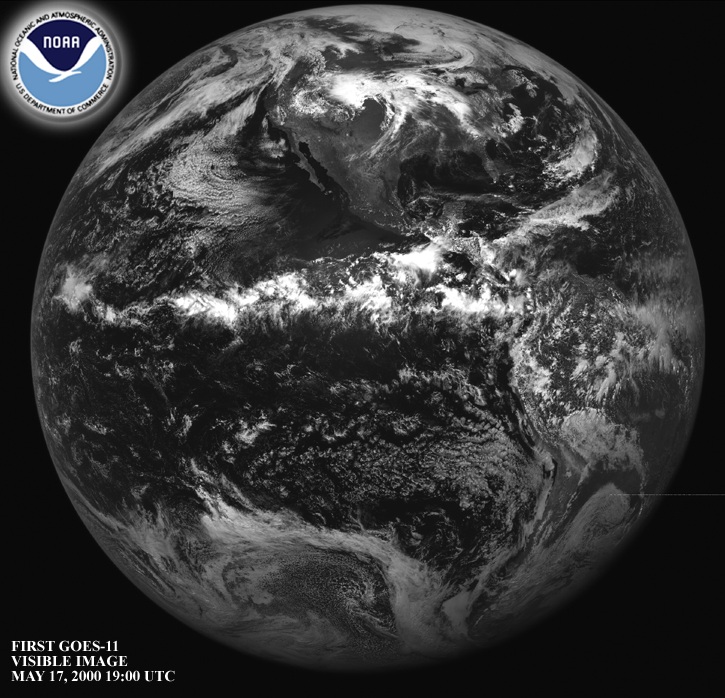
Fig. 4 The Earth
viewed from space with the GOES-11 satellite (May 2000). Visible image
over the Pacific Ocean. Beneath the clouds, you can see the outline of
the North and South American continents (click on the image to get a larger
view)
Fig. 5
Infrared satellite image (GOES-West satellite) showing the Pacific
Ocean and North America - October 22, 2001 (click on the image to
get a larger view). Note the extratropical cyclone over the Pacific
Northwest, and hurricane Narda in the tropical Eastern Pacific.
Last
Updated:
10/23/2001